Chart Types
Explore comprehensive guides on various data visualization chart types. Learn when and how to use each chart for effective data communication.
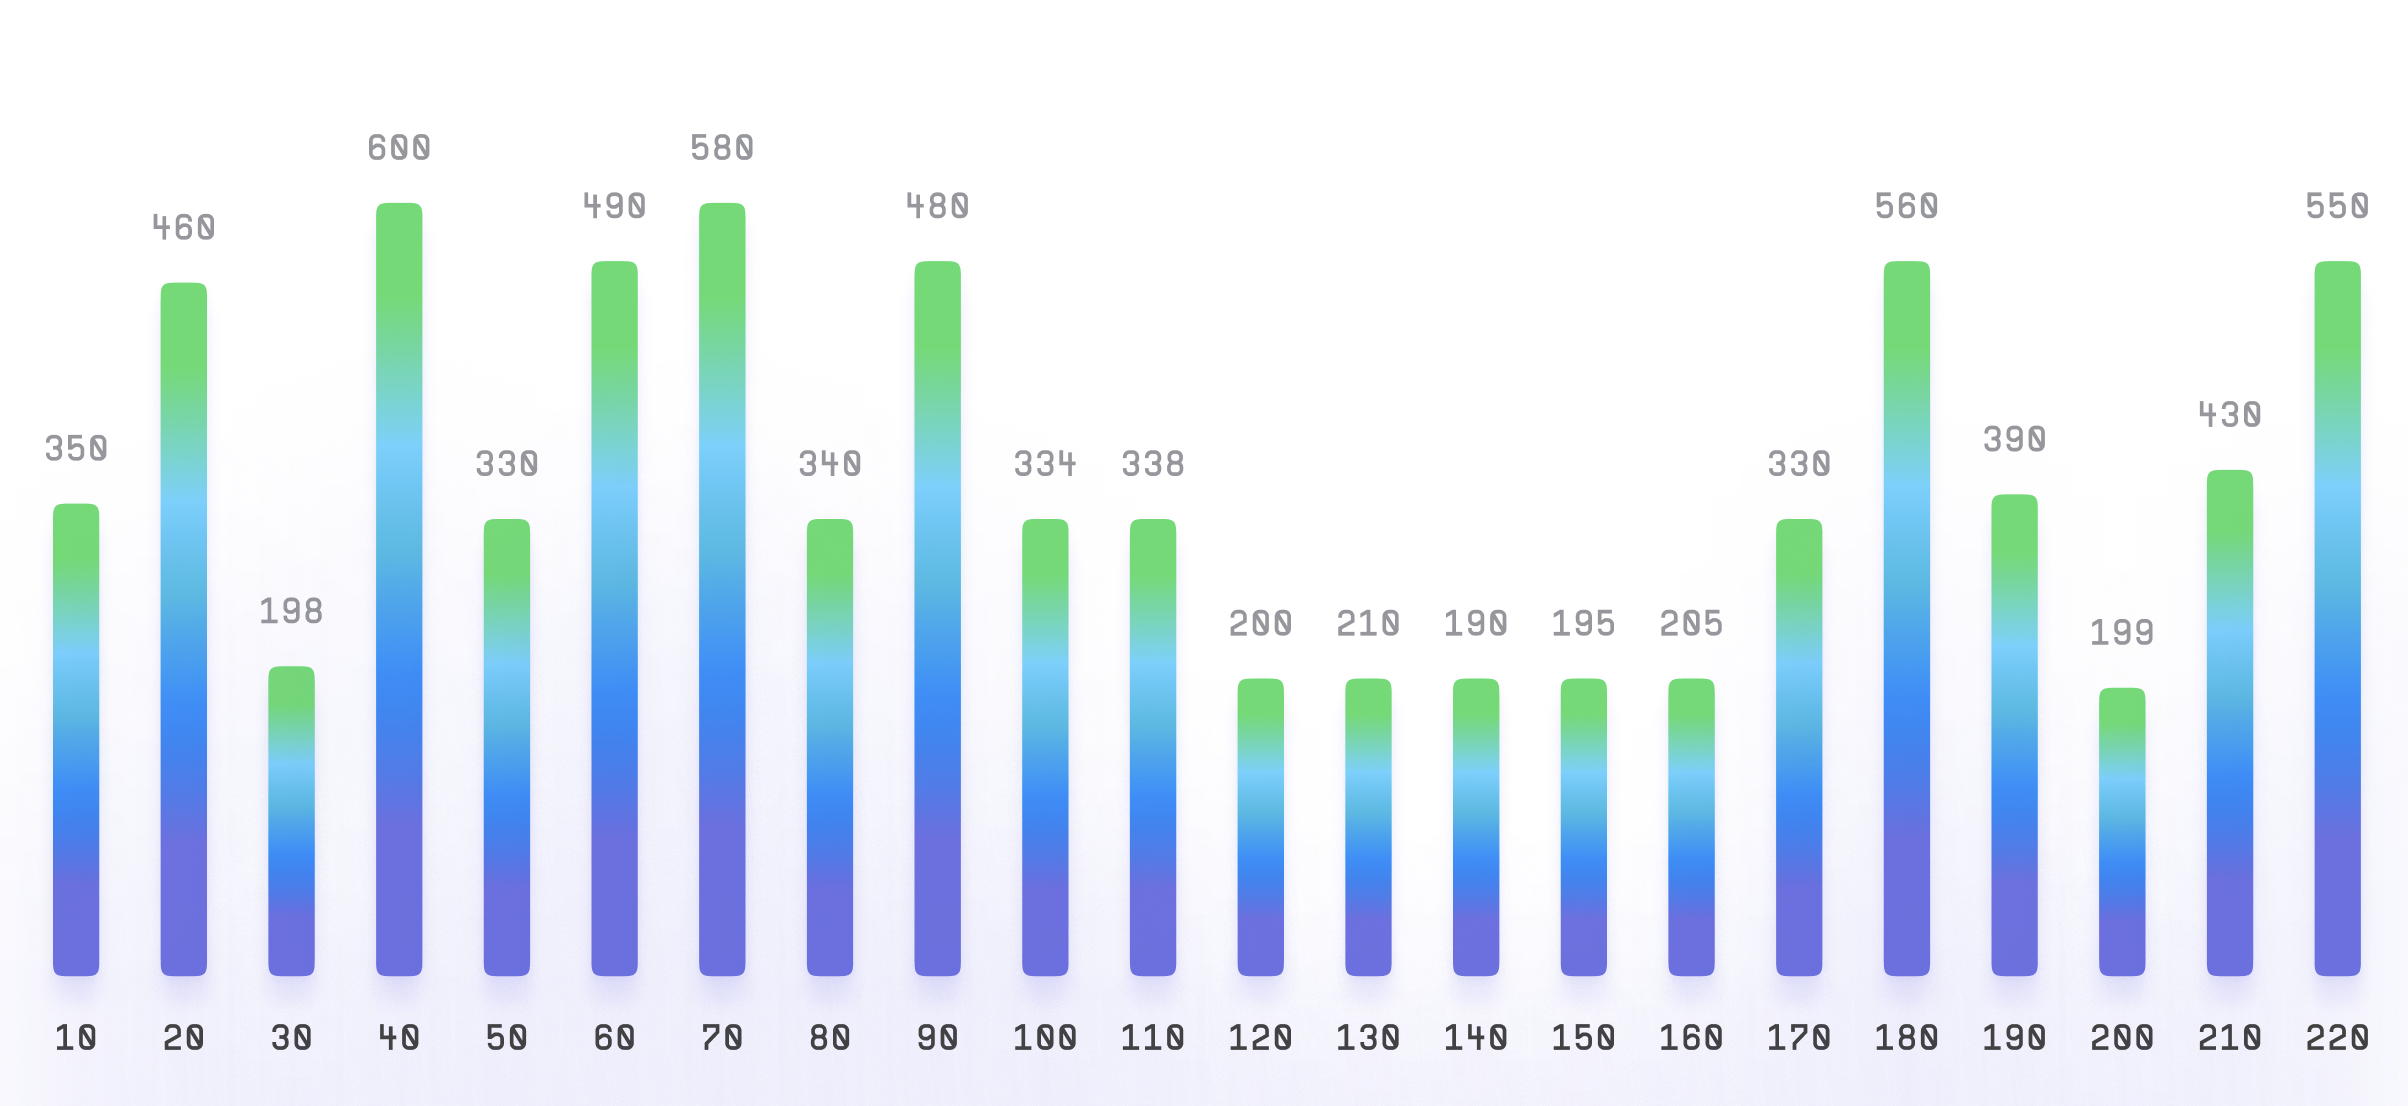
Bar Chart
Bar chart, also known as a bar graph, is a type of chart used to display data using rectangular bars...
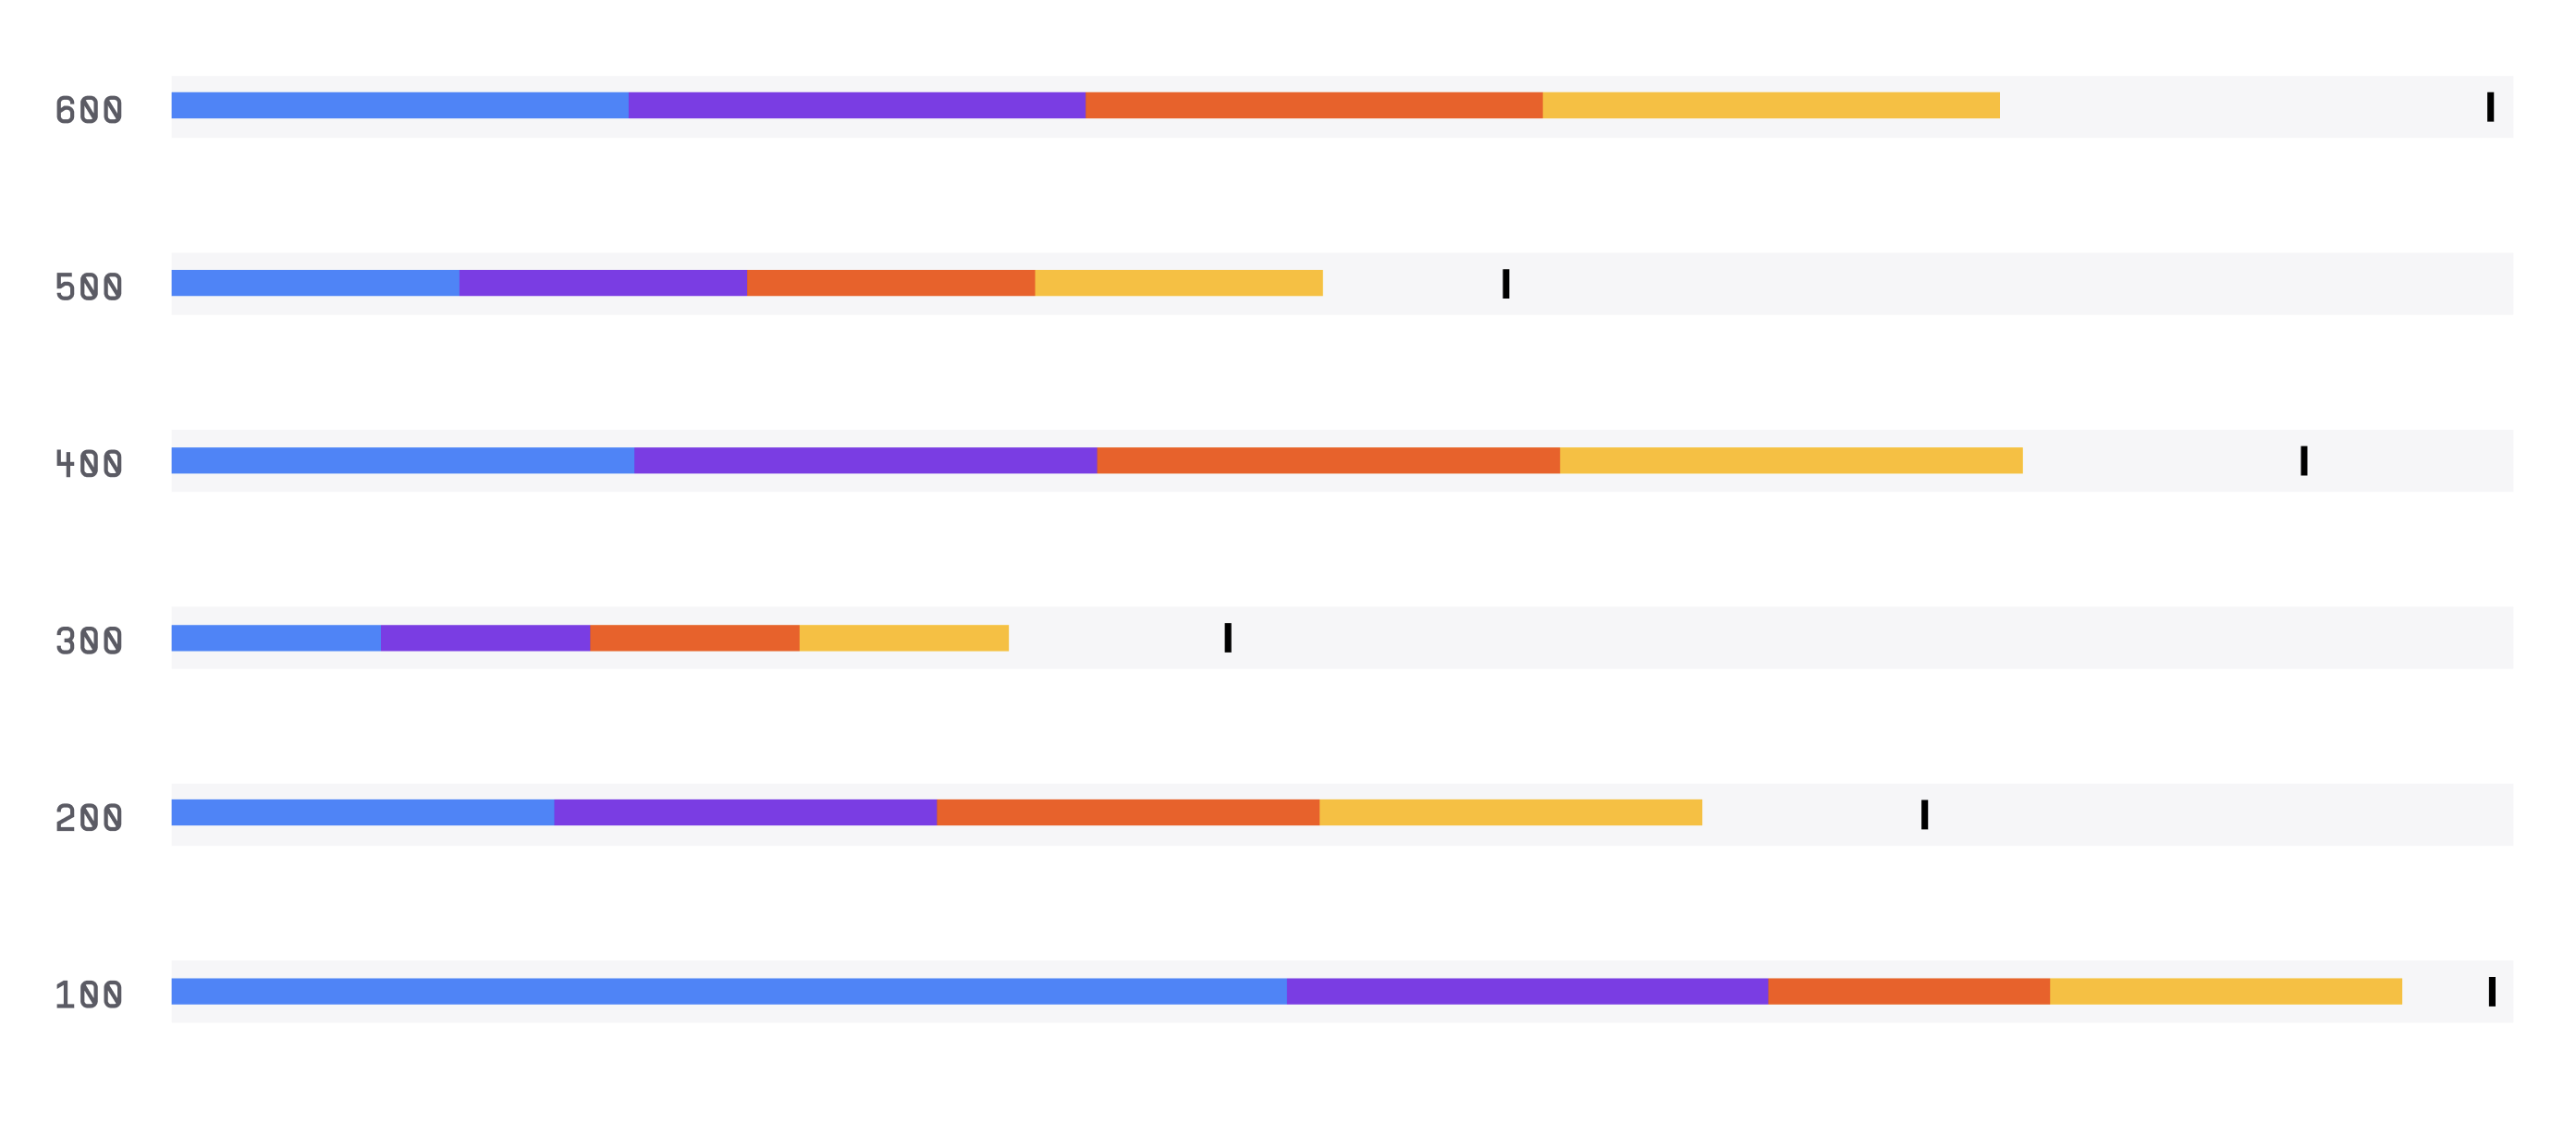
Bullet Chart
The Bullet Graph is a data visualization chart that is used to display a single measure along with a...
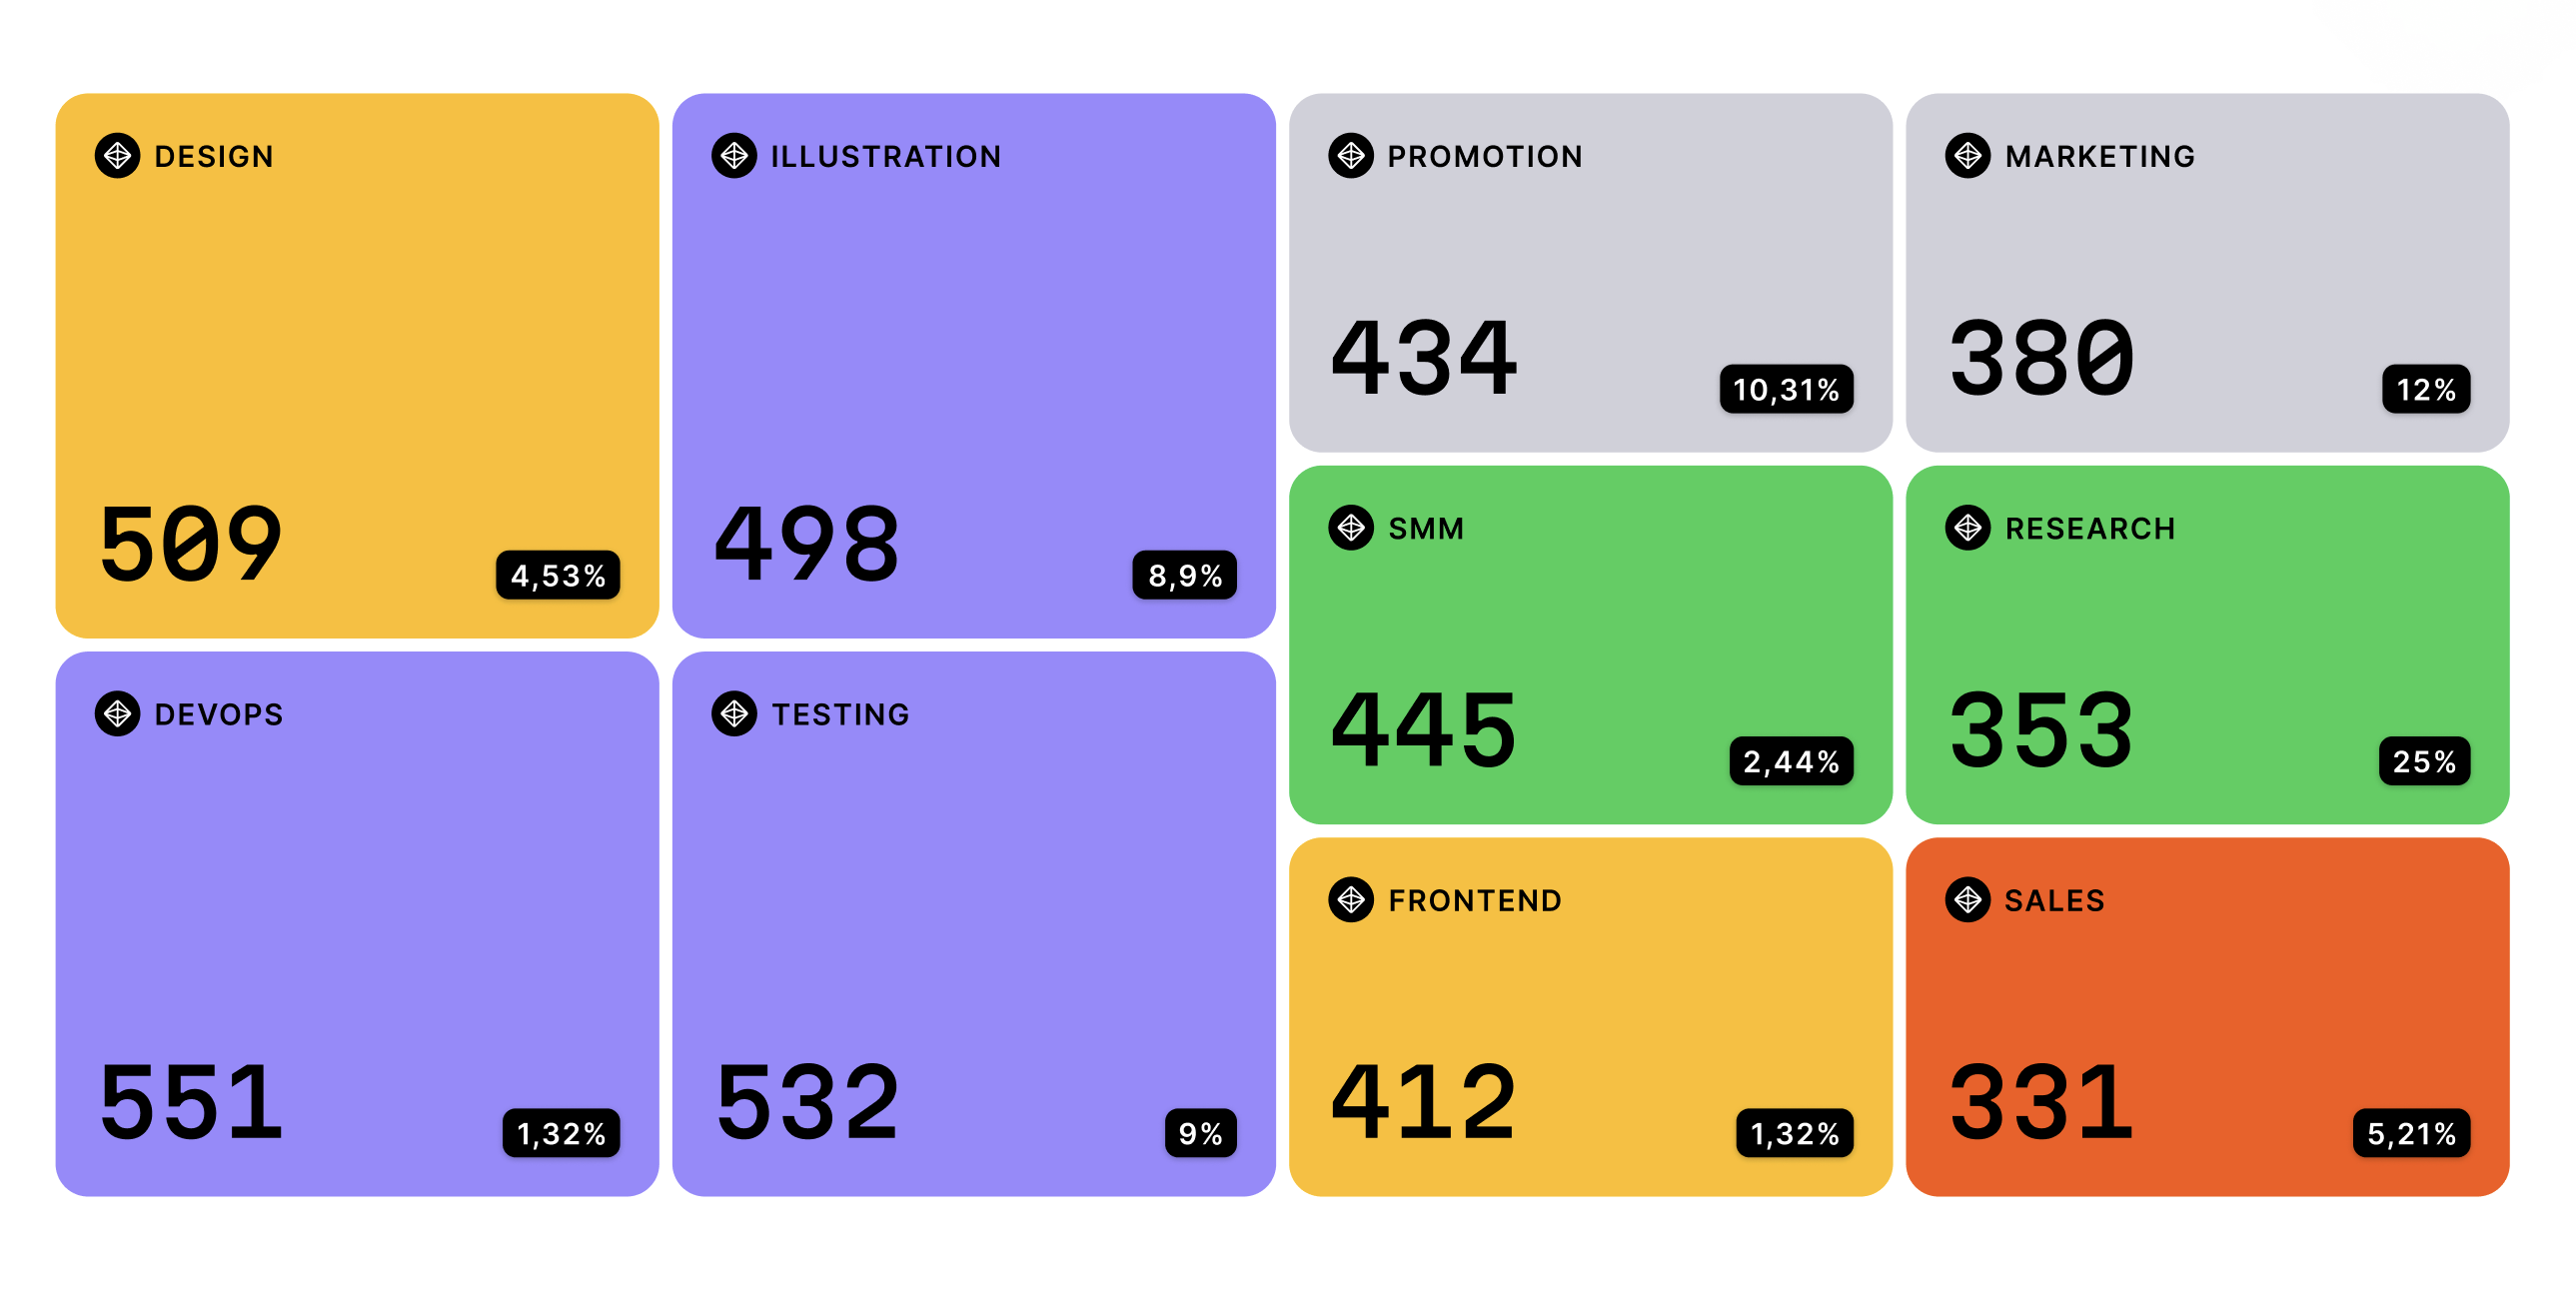
Treemap Chart
Treemap Chart is a data visualization chart that is used to display hierarchical data in a rectangul...
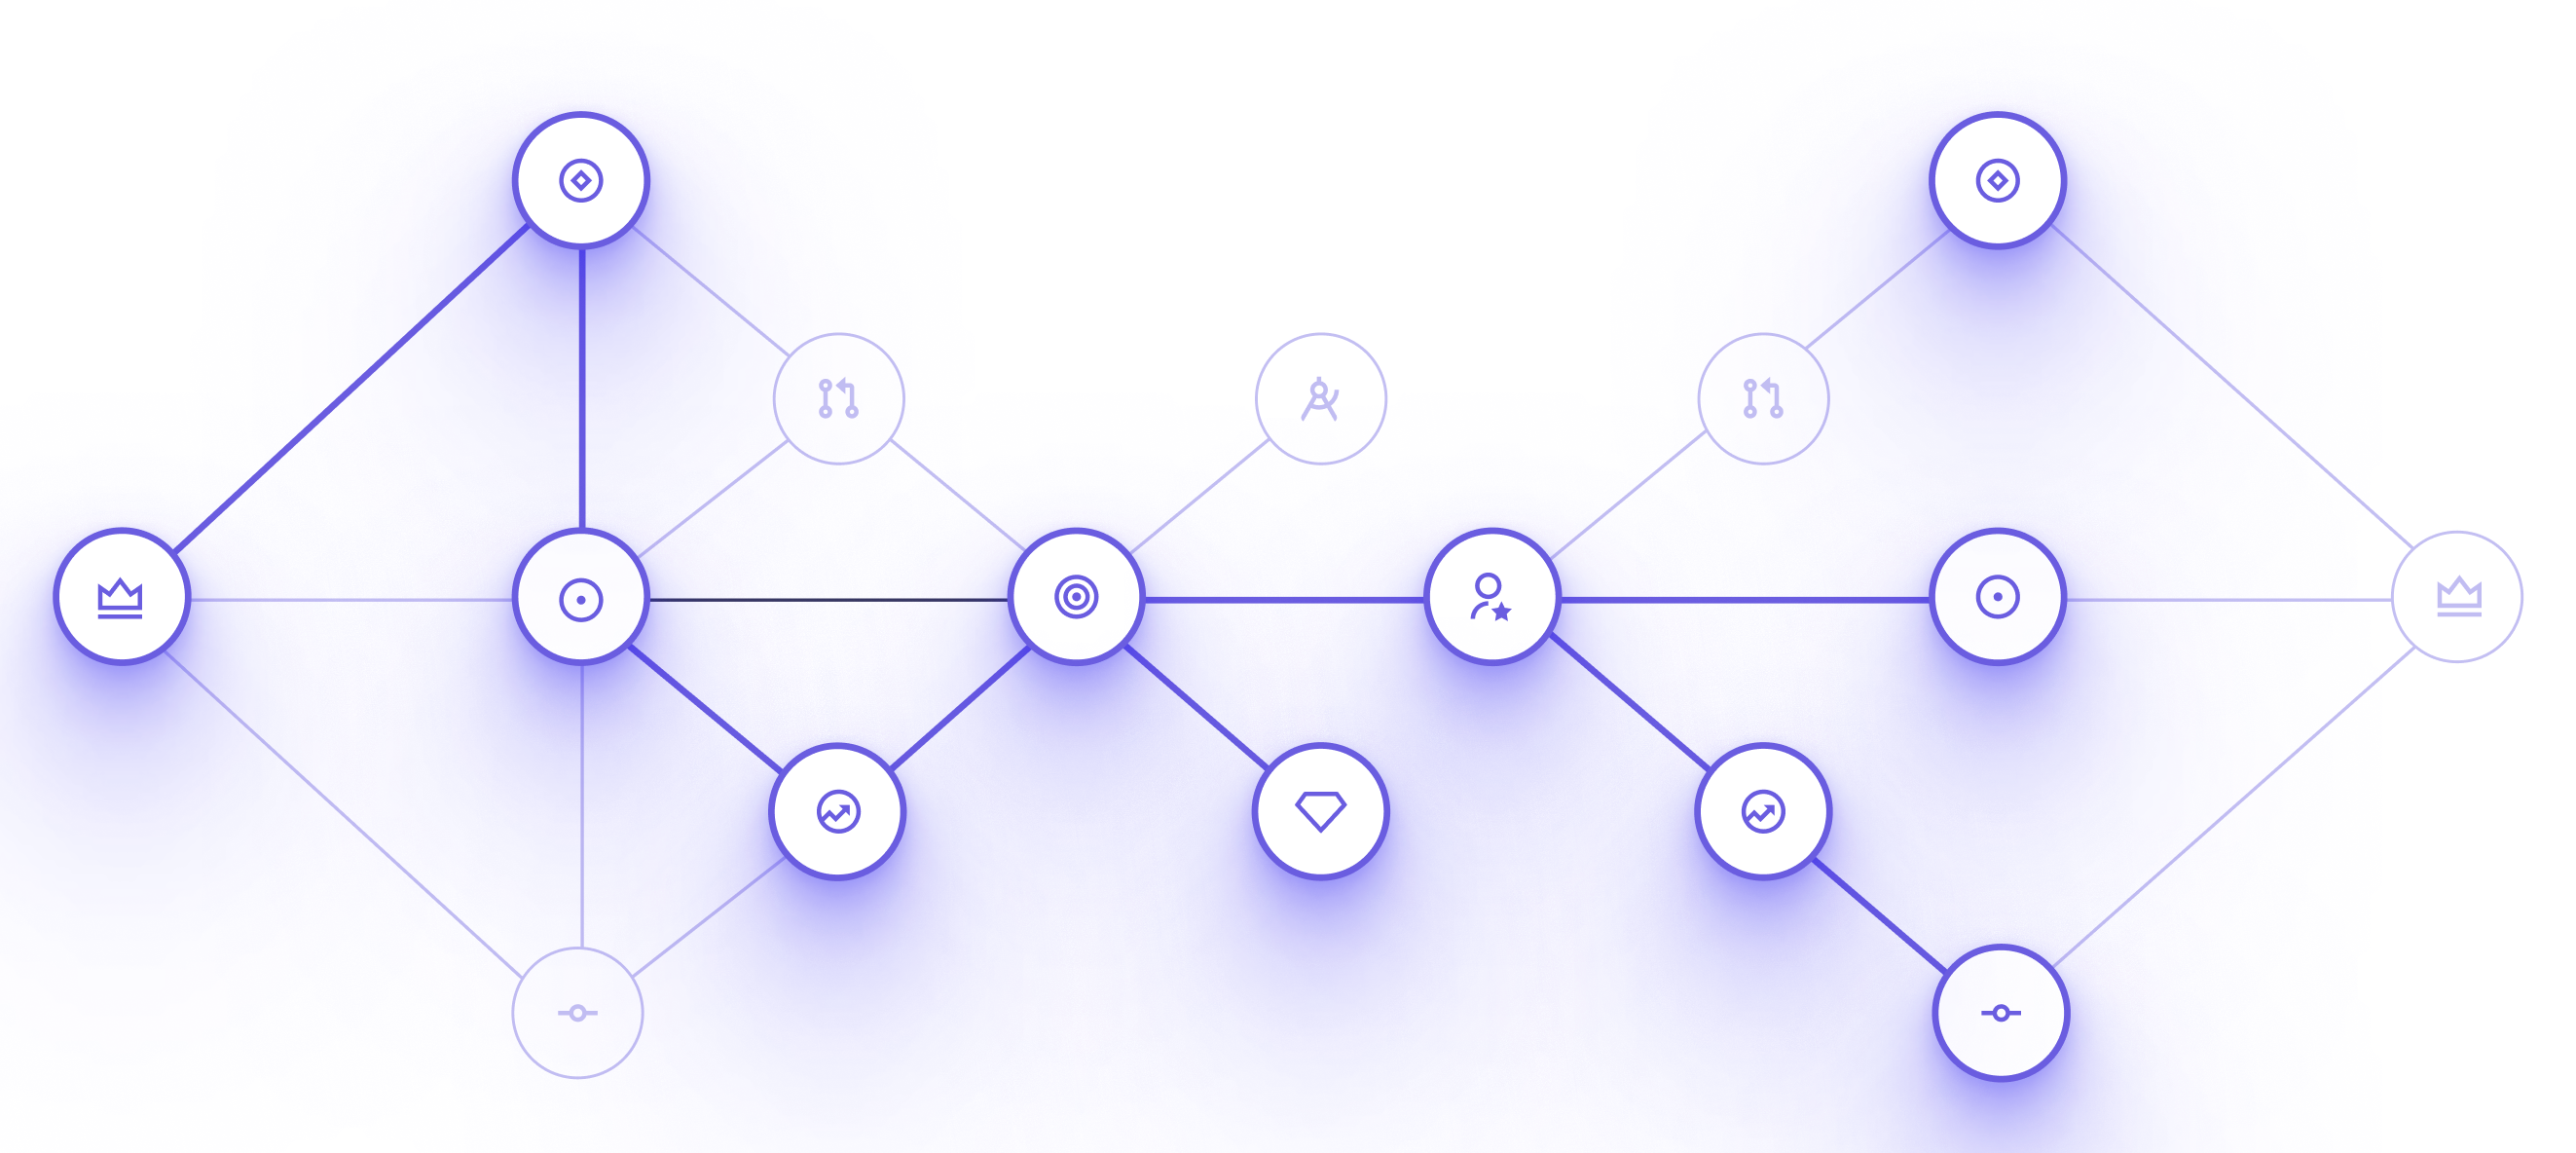
Tree Chart
Tree Chart or Tree Graph is a data visualization chart that is used to display hierarchical data in ...
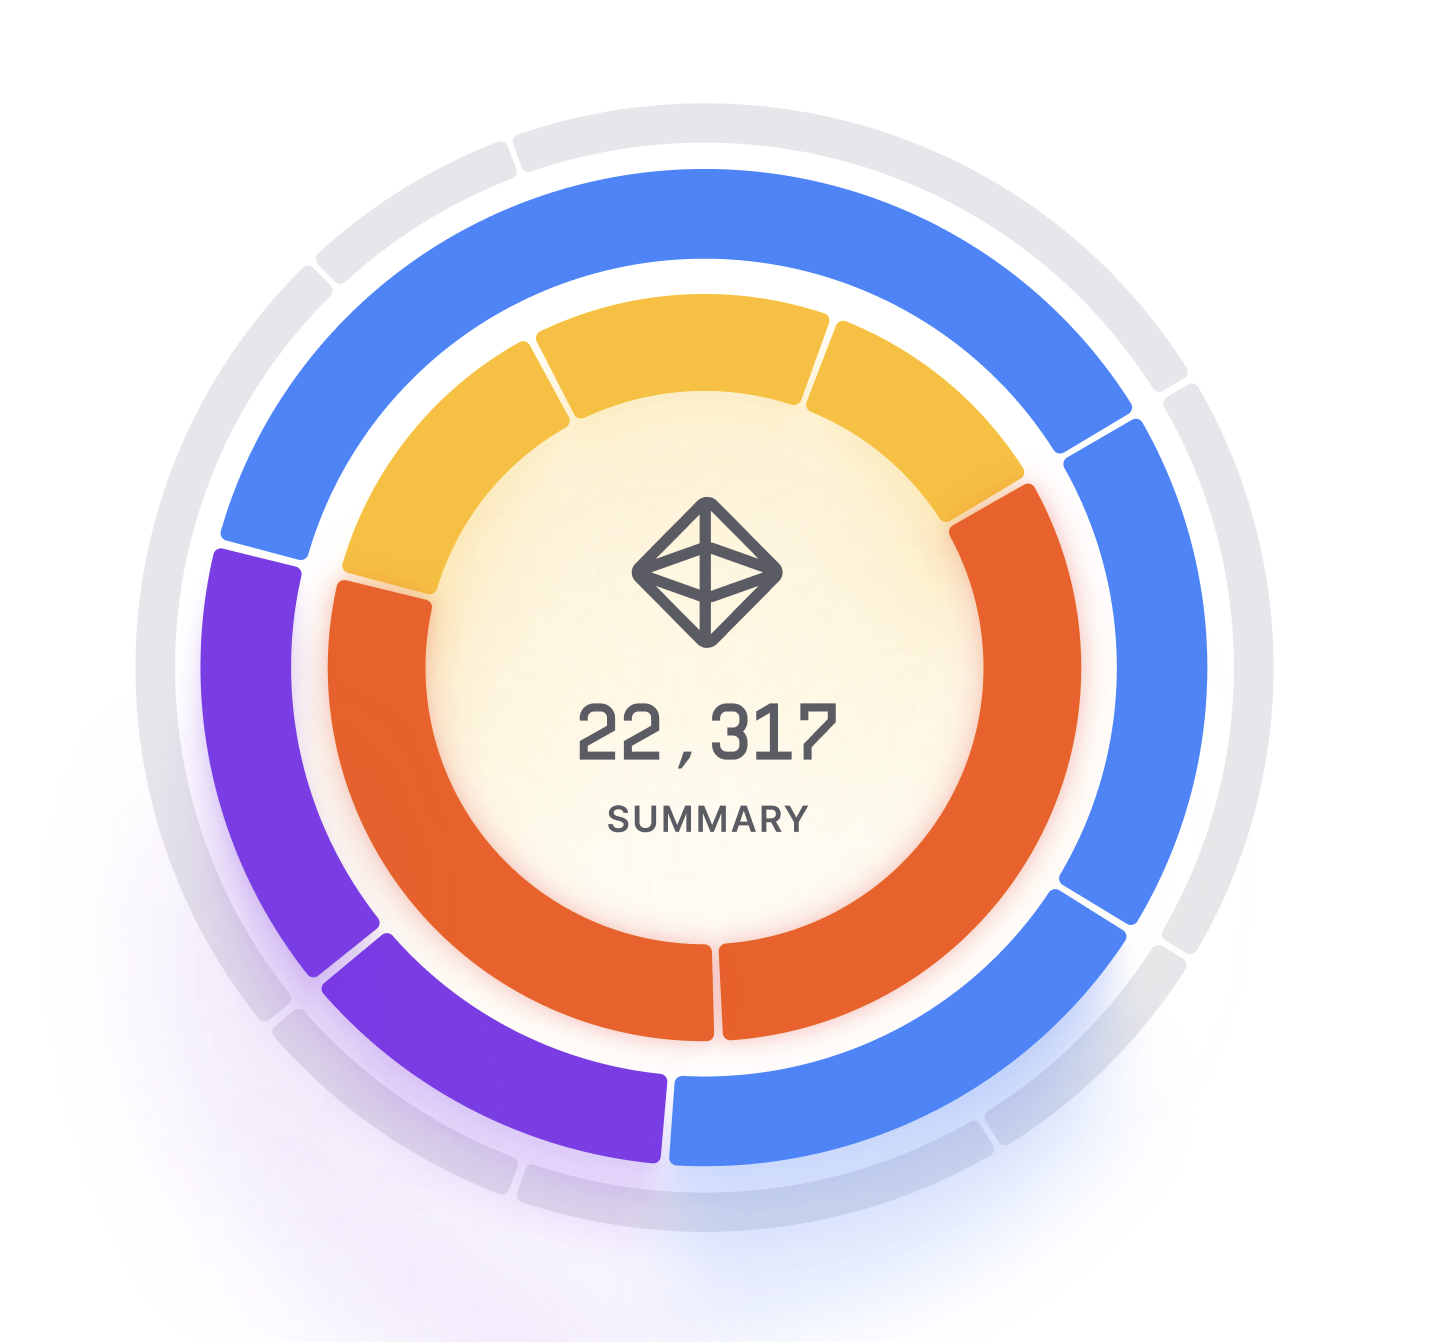
Sunburst Chart
Sunburst Chart is a data visualization chart that is used to display hierarchical data in a circular...
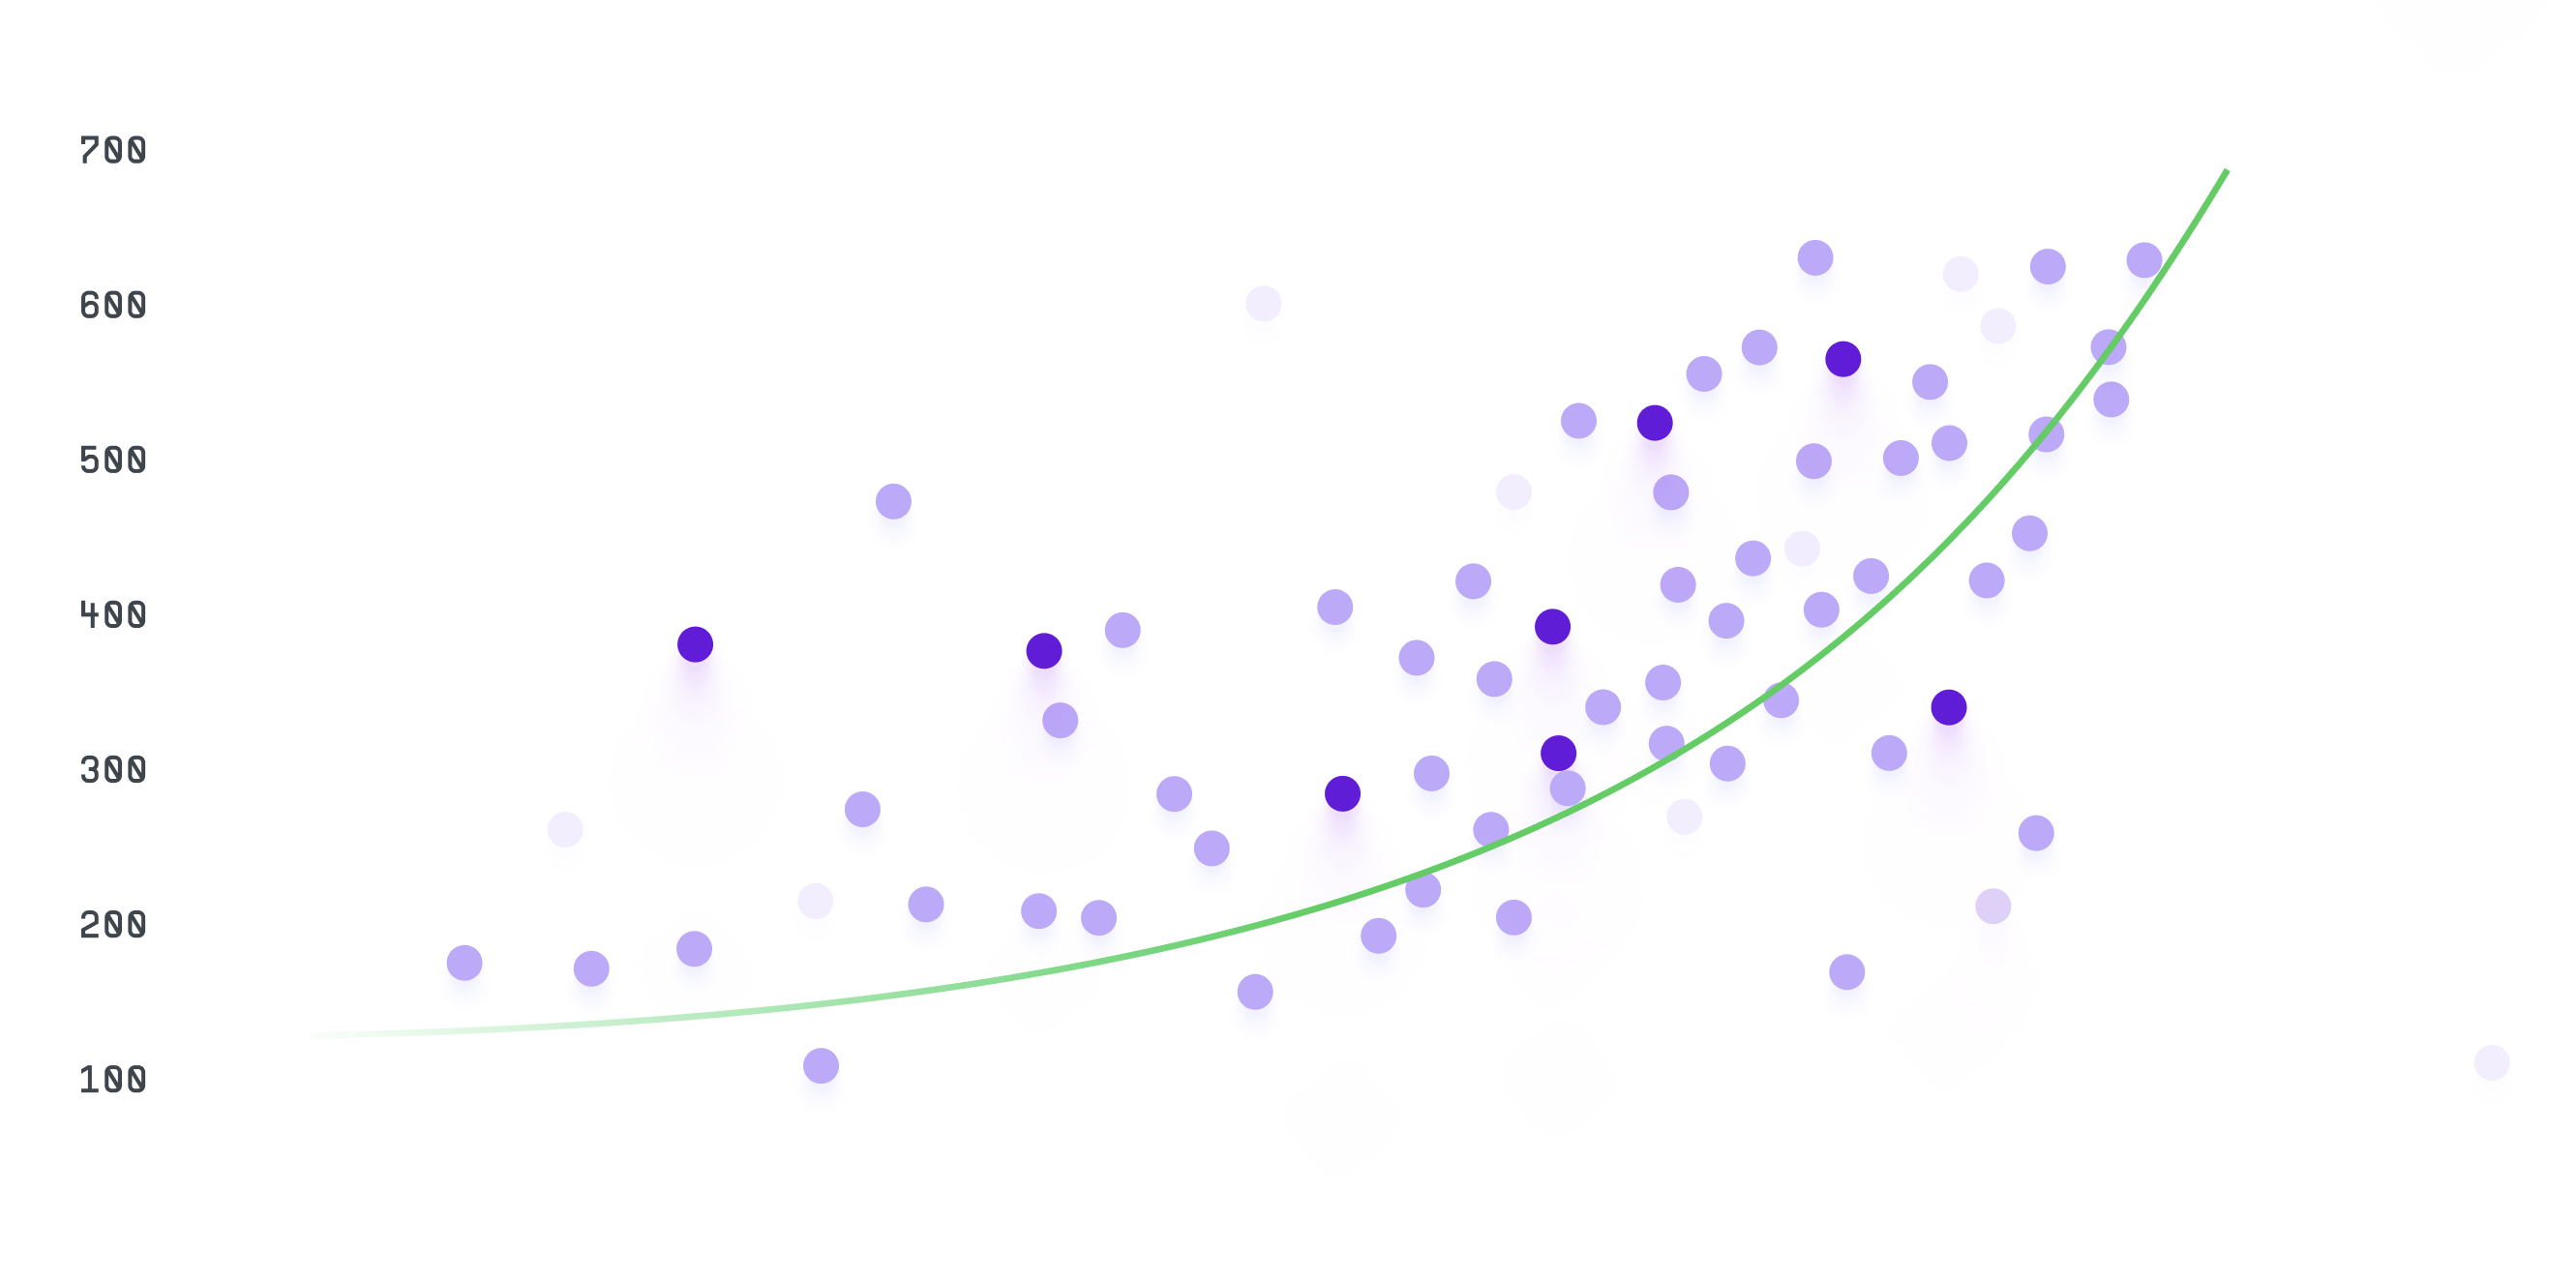
Scatter Chart
Scatter chart, also known as a scatter plot or scatter graph, is a type of chart used to display the...
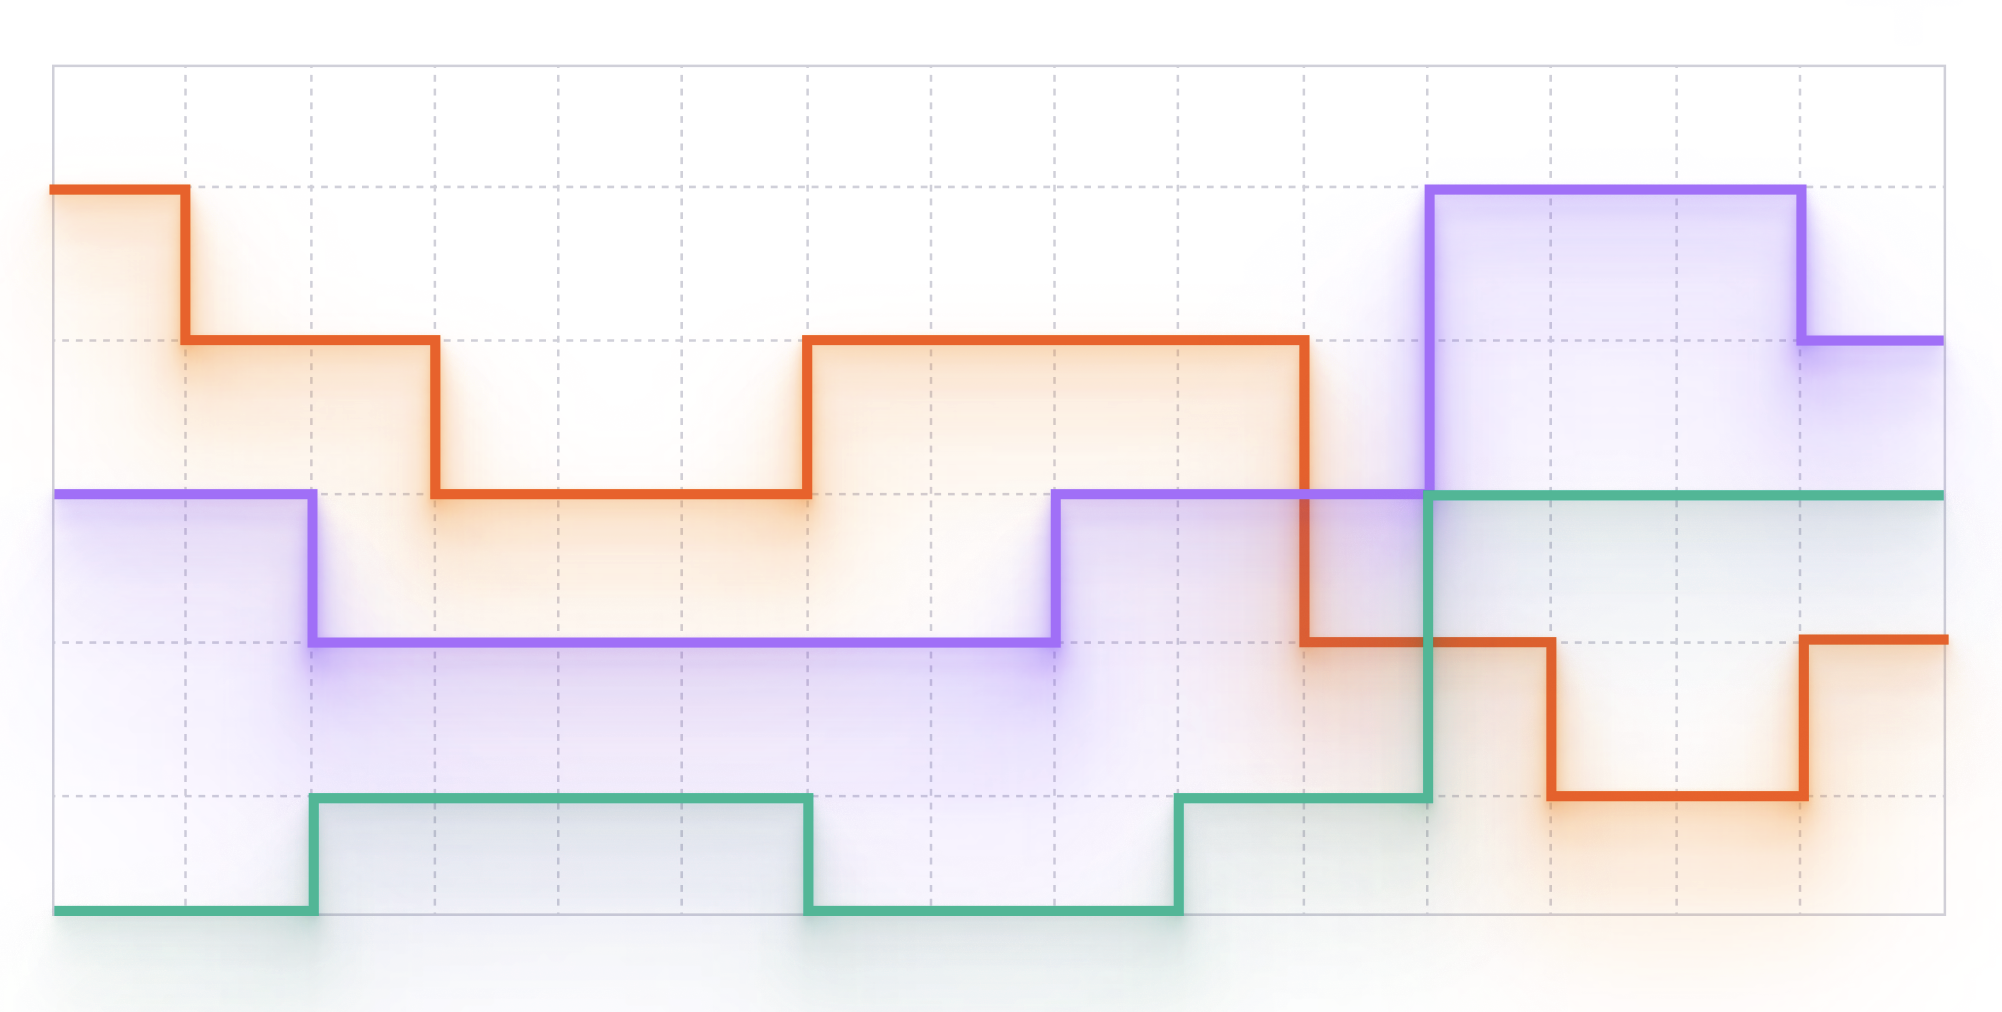
Stepped Line Chart
Stepped line graph, also called a step chart, is a type of chart used to display data that changes a...
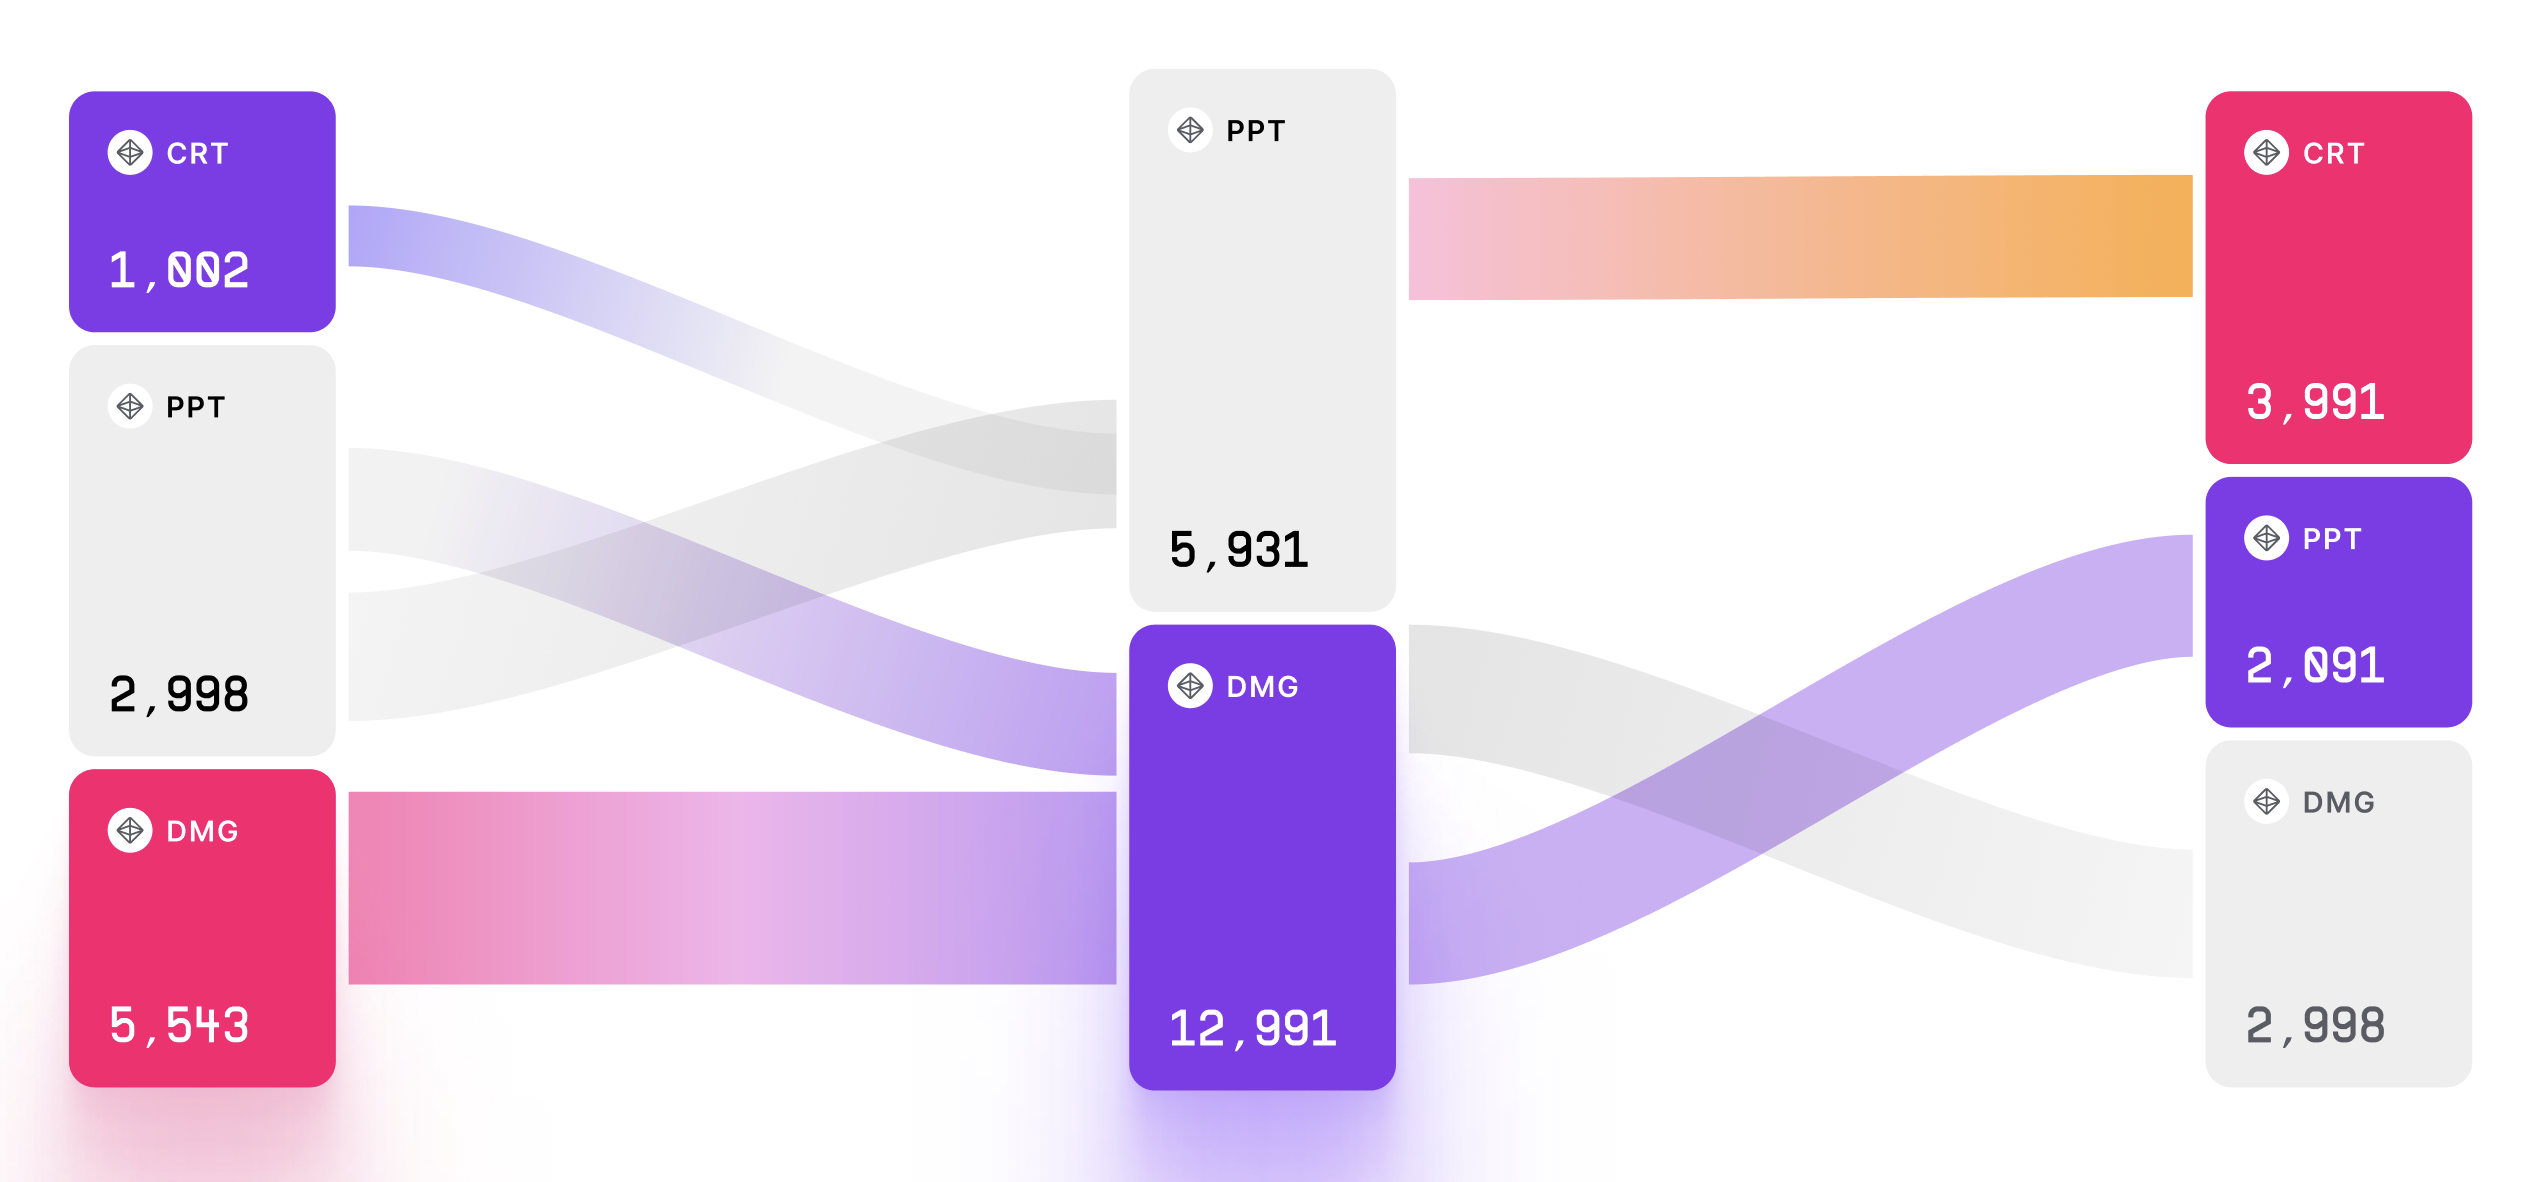
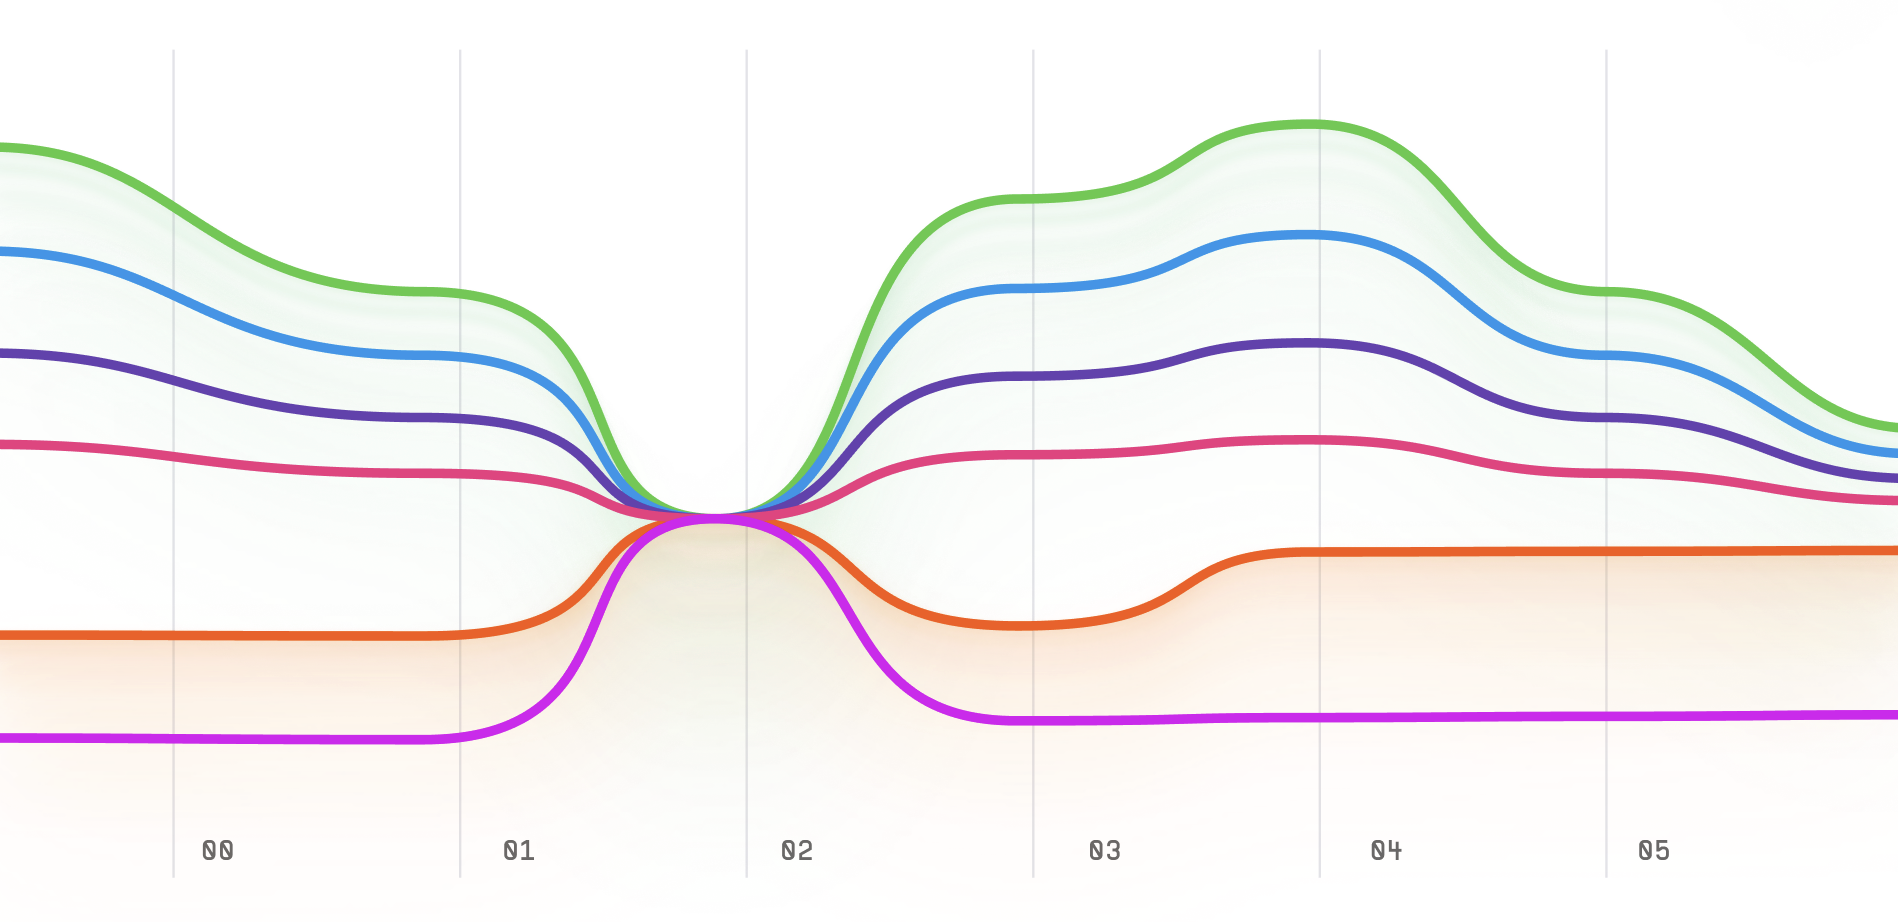
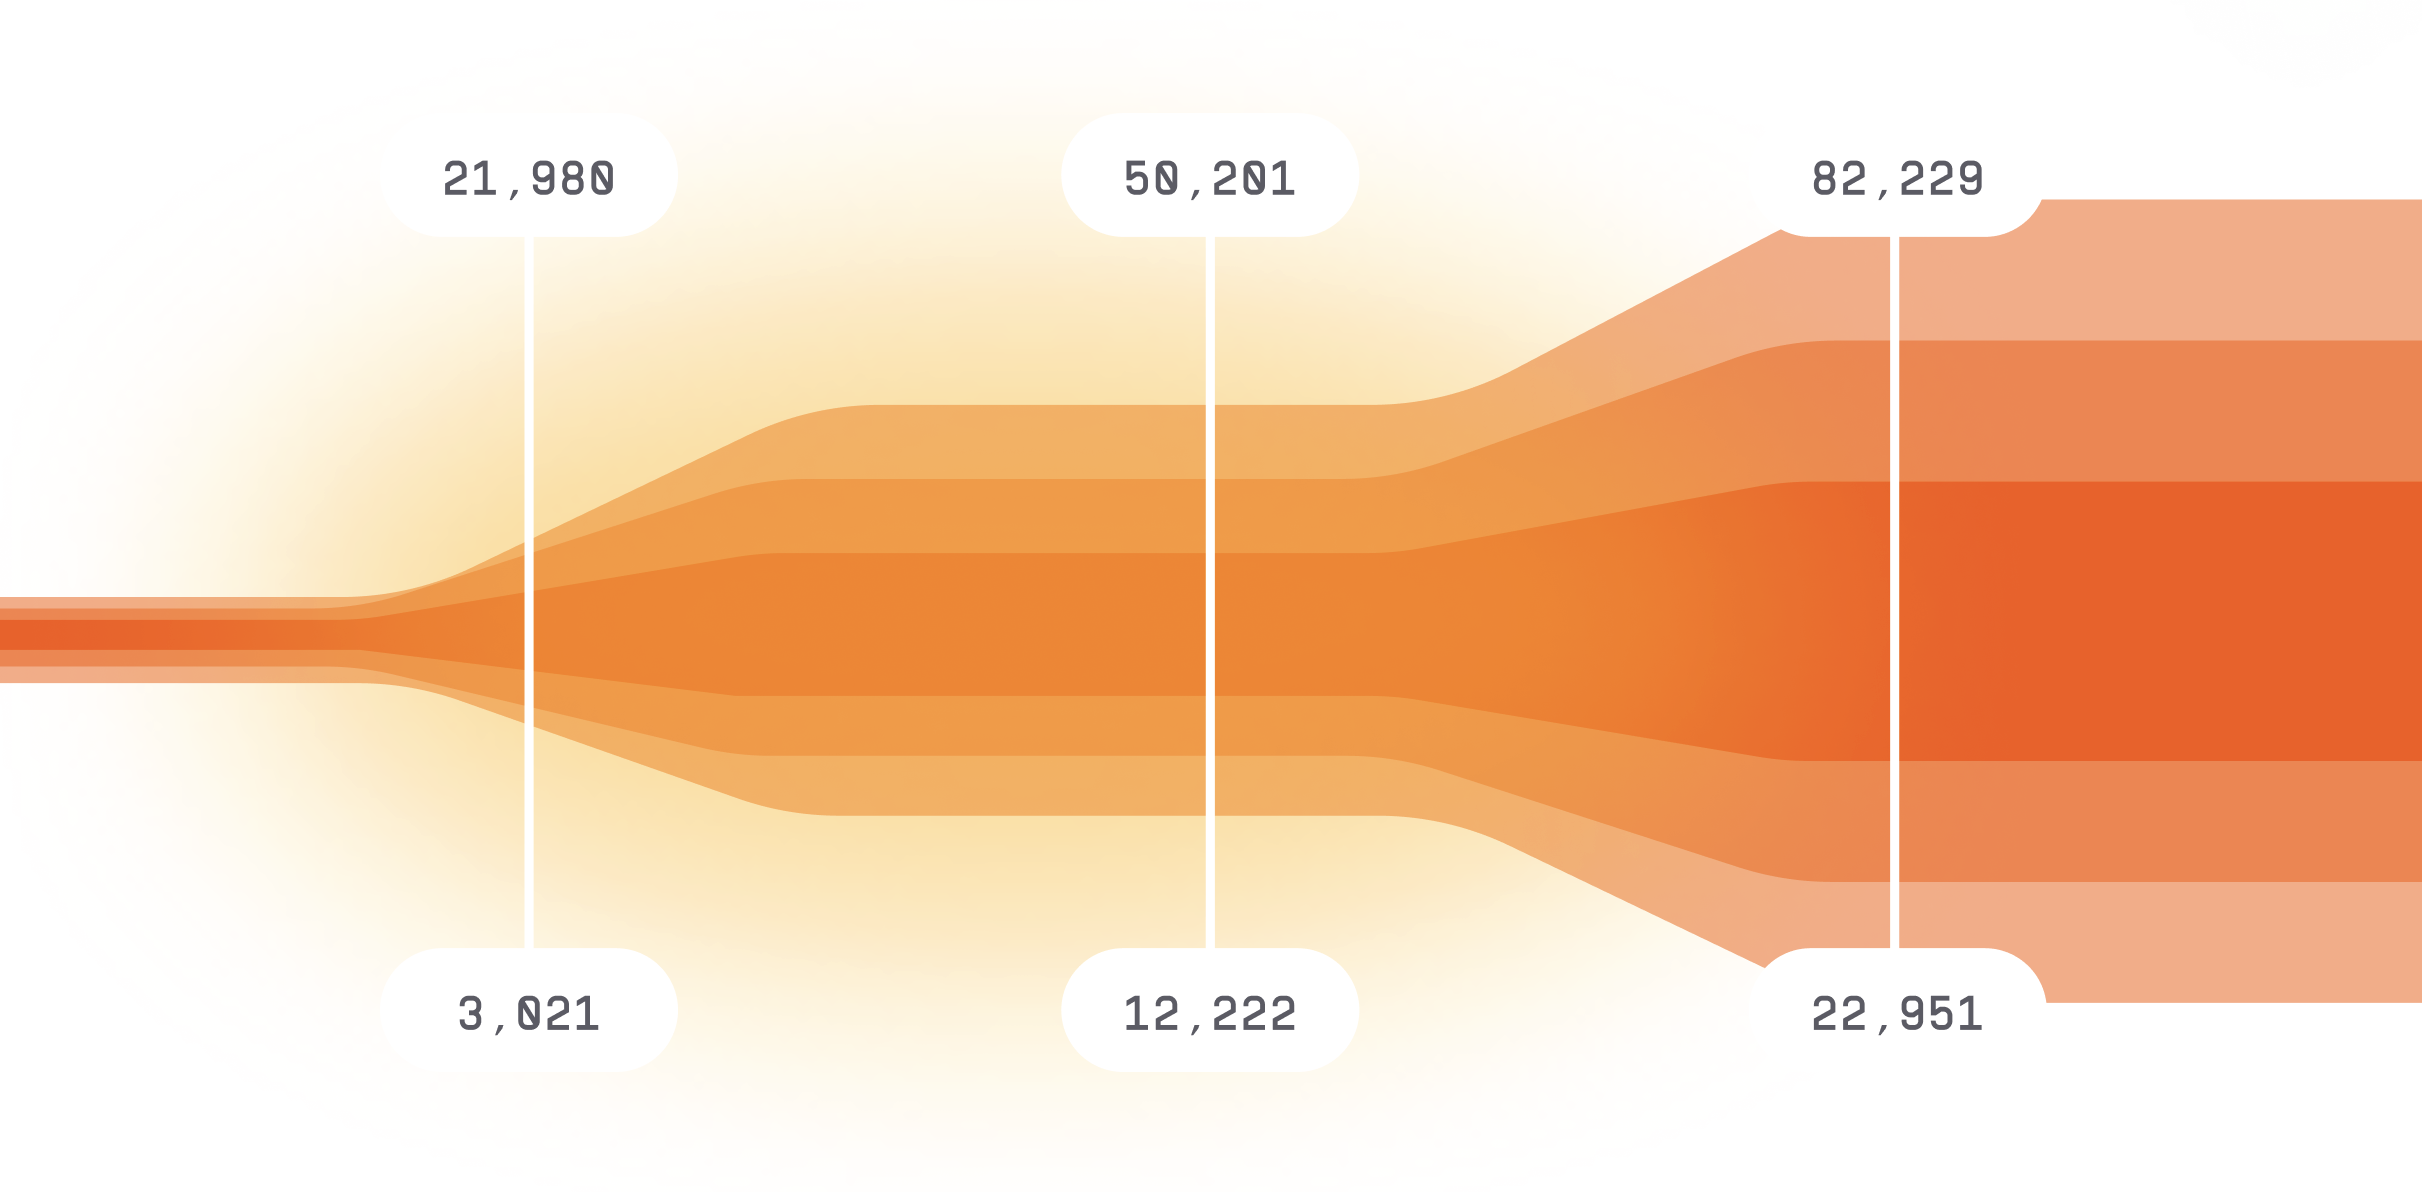
Sankey Chart
Sankey Chart is a data visualization chart that is used to show the flow of data or resources throug...
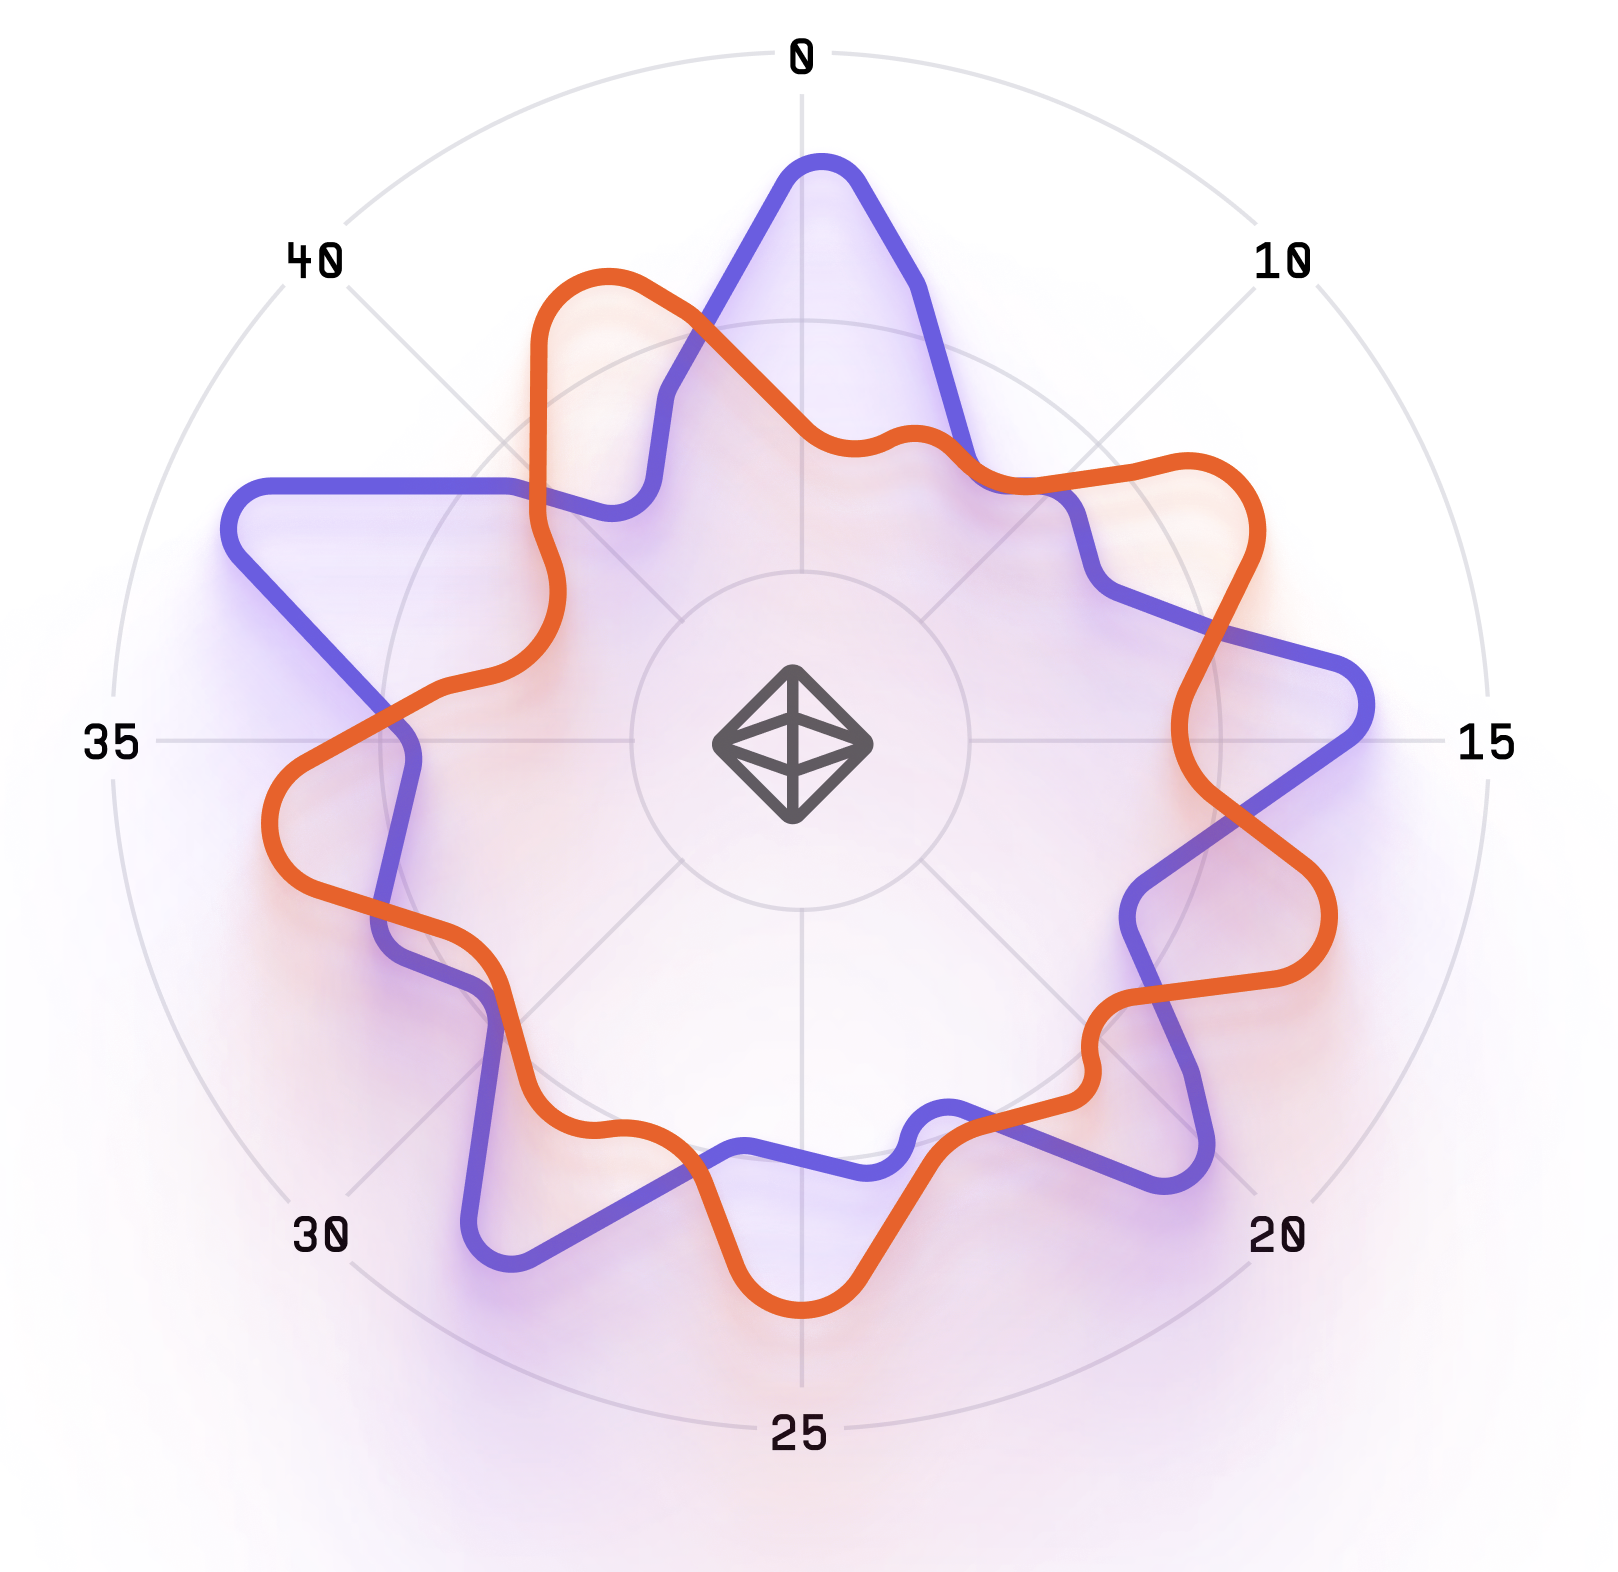
Radar Chart
The Radar Chart, also known as a Spider Chart or Polar Chart, is a data visualization chart that is ...
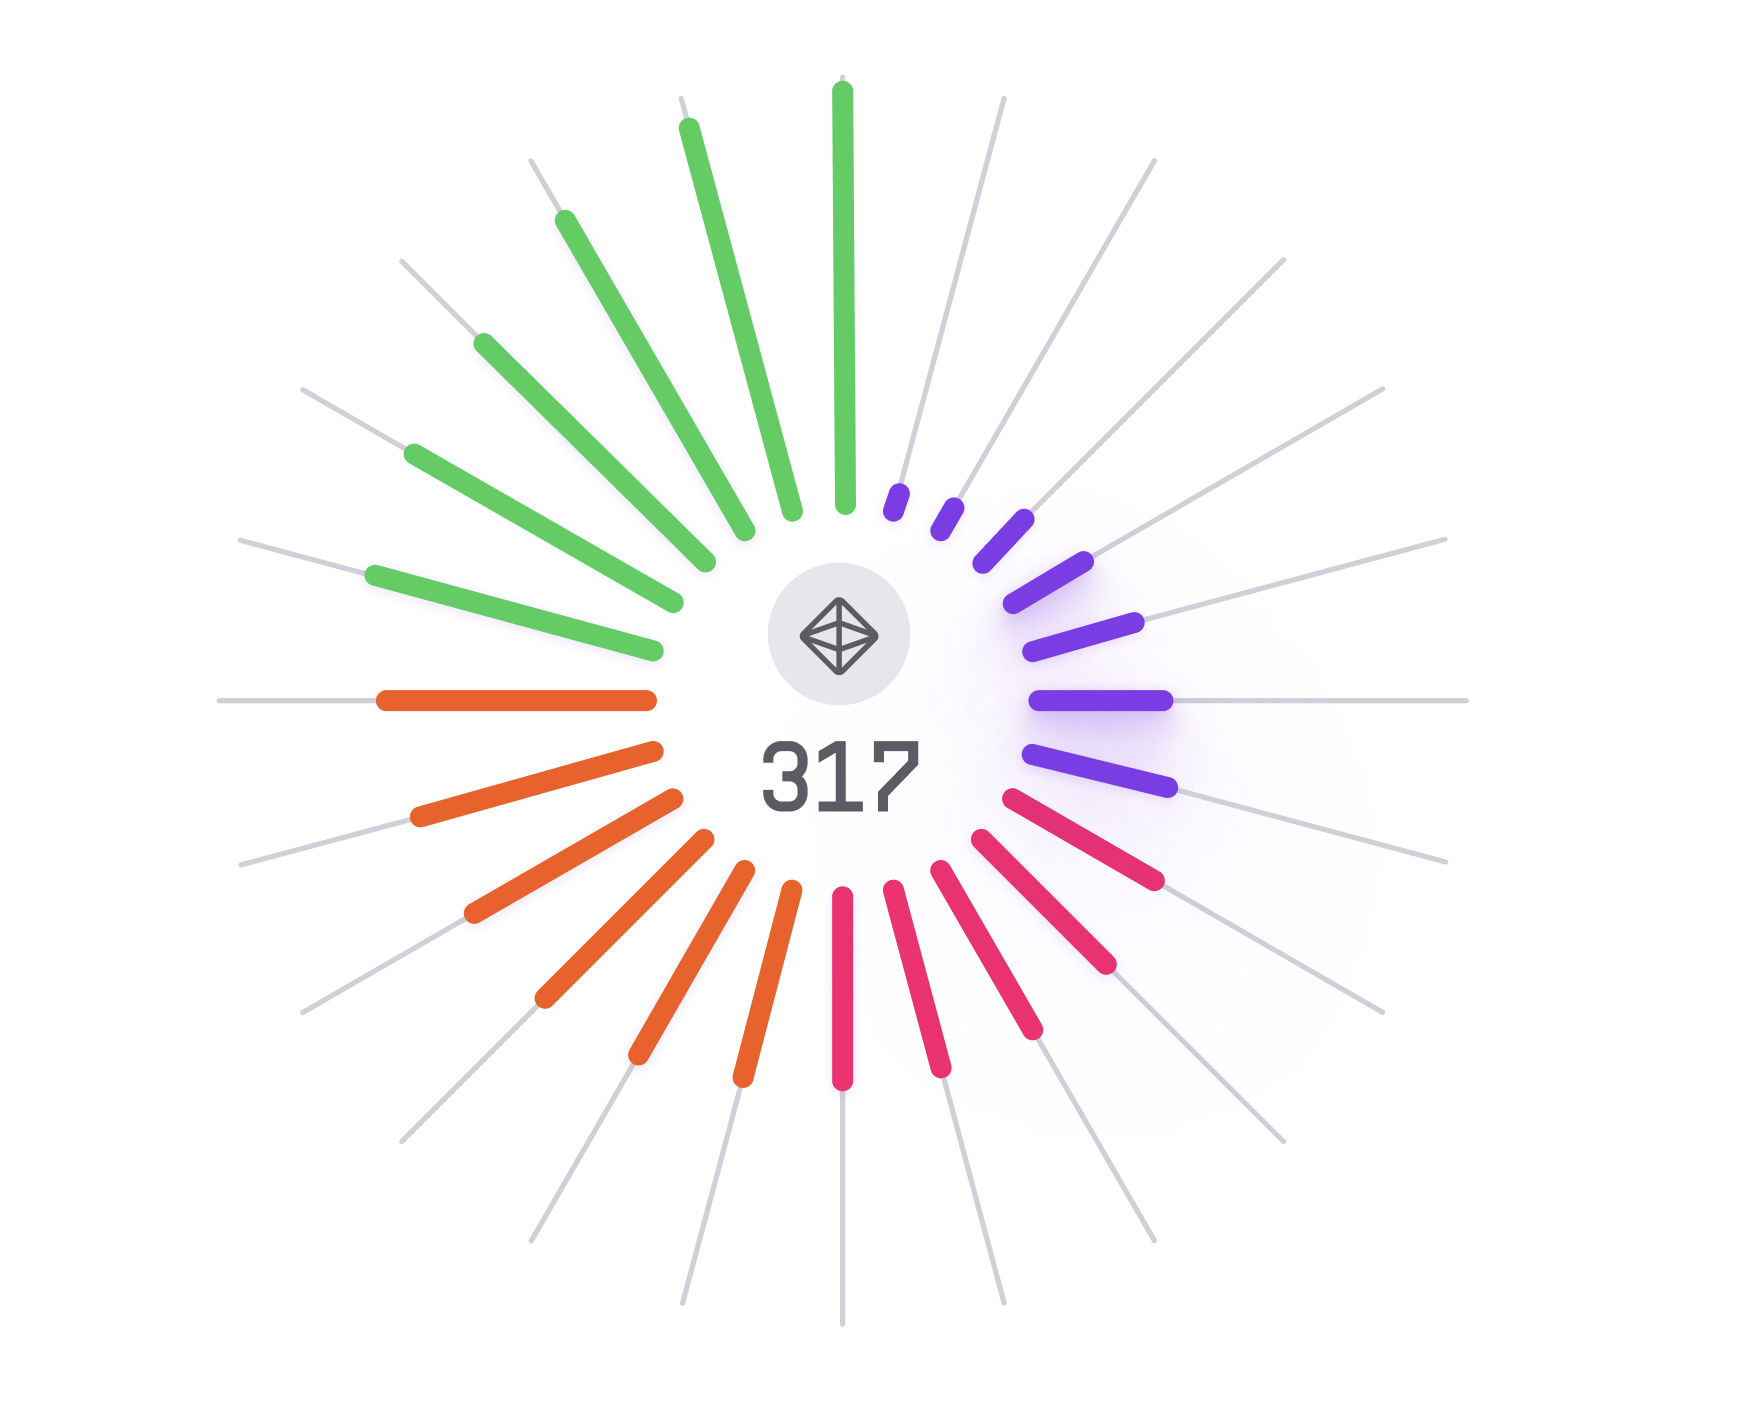
Radial Convergence Chart
Radial convergence chart is a type of data visualization tool that represents the convergence, diver...
Radial Histogram
Radial histogram, also known as a circular histogram, is a type of chart used to display the distrib...
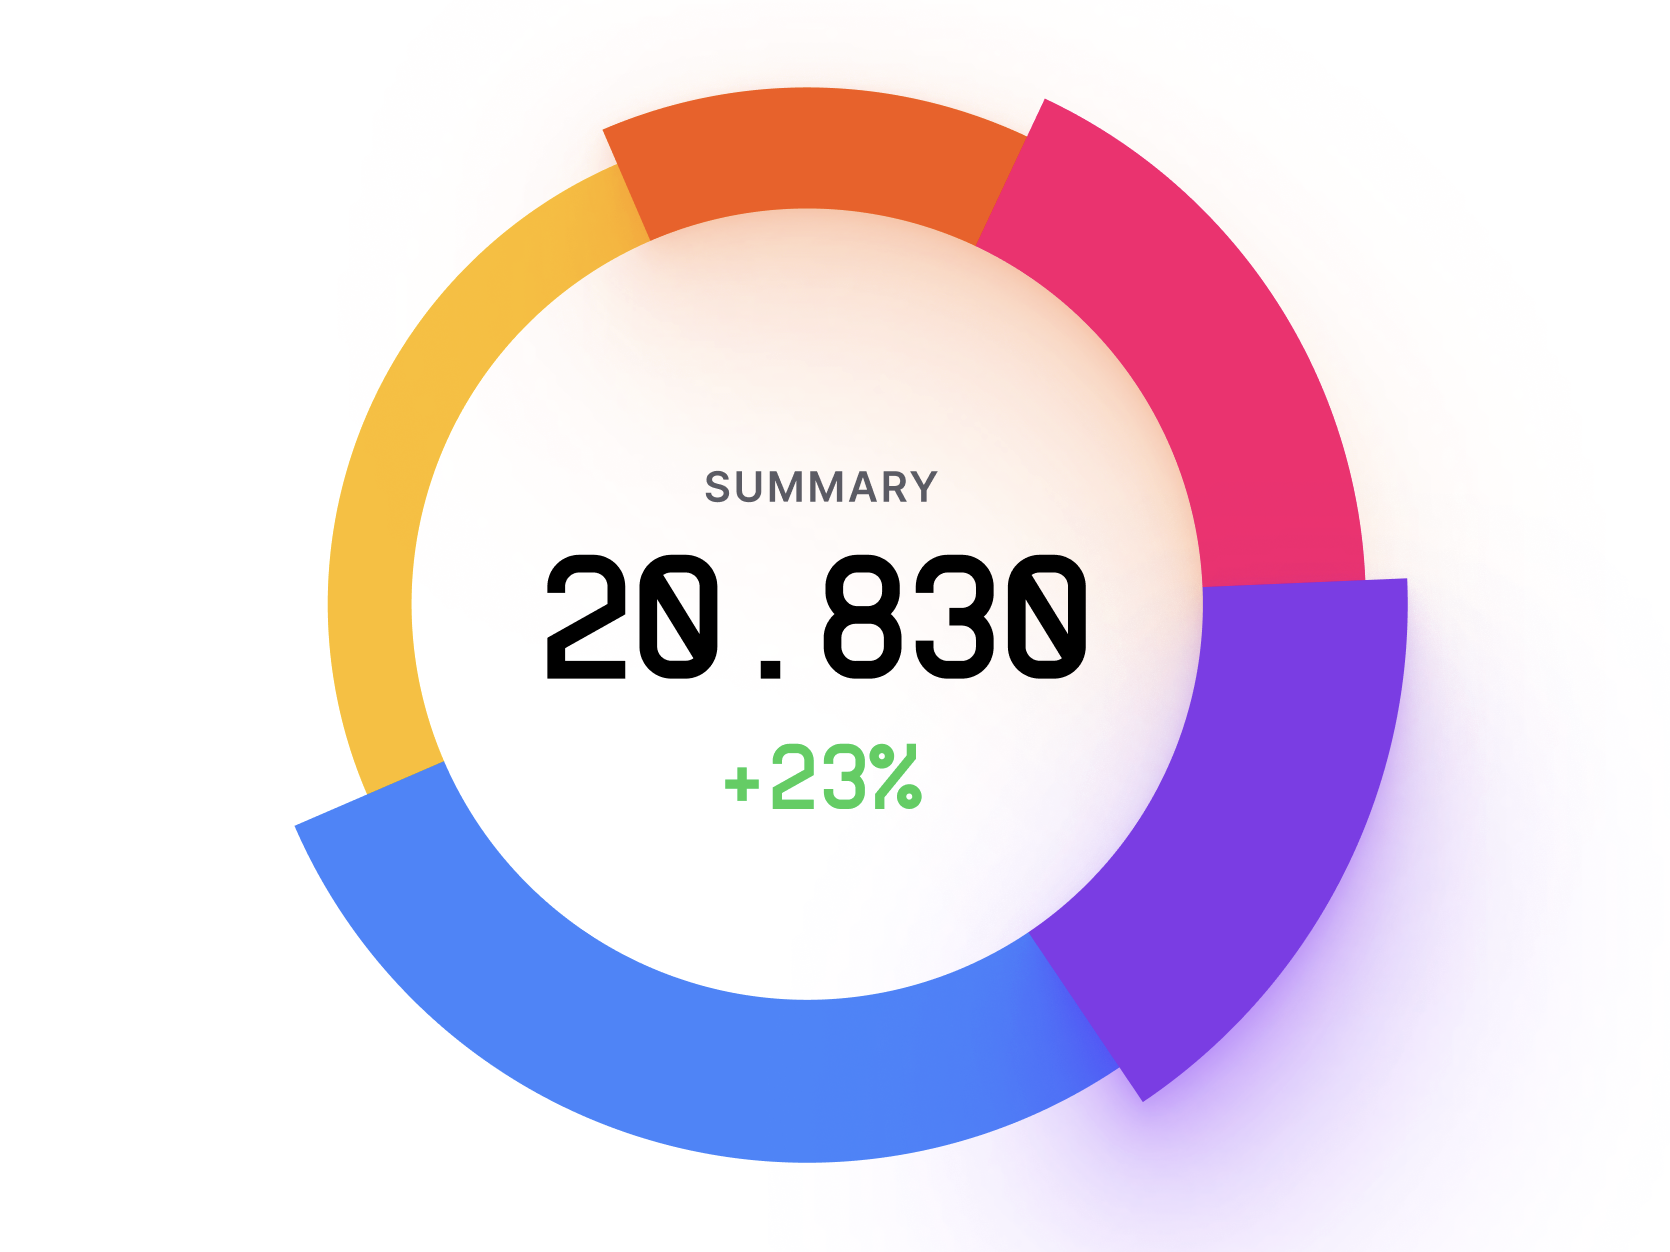
Pie Chart
Pie chart is a type of chart used to display data as a circle divided into slices. Each slice repres...
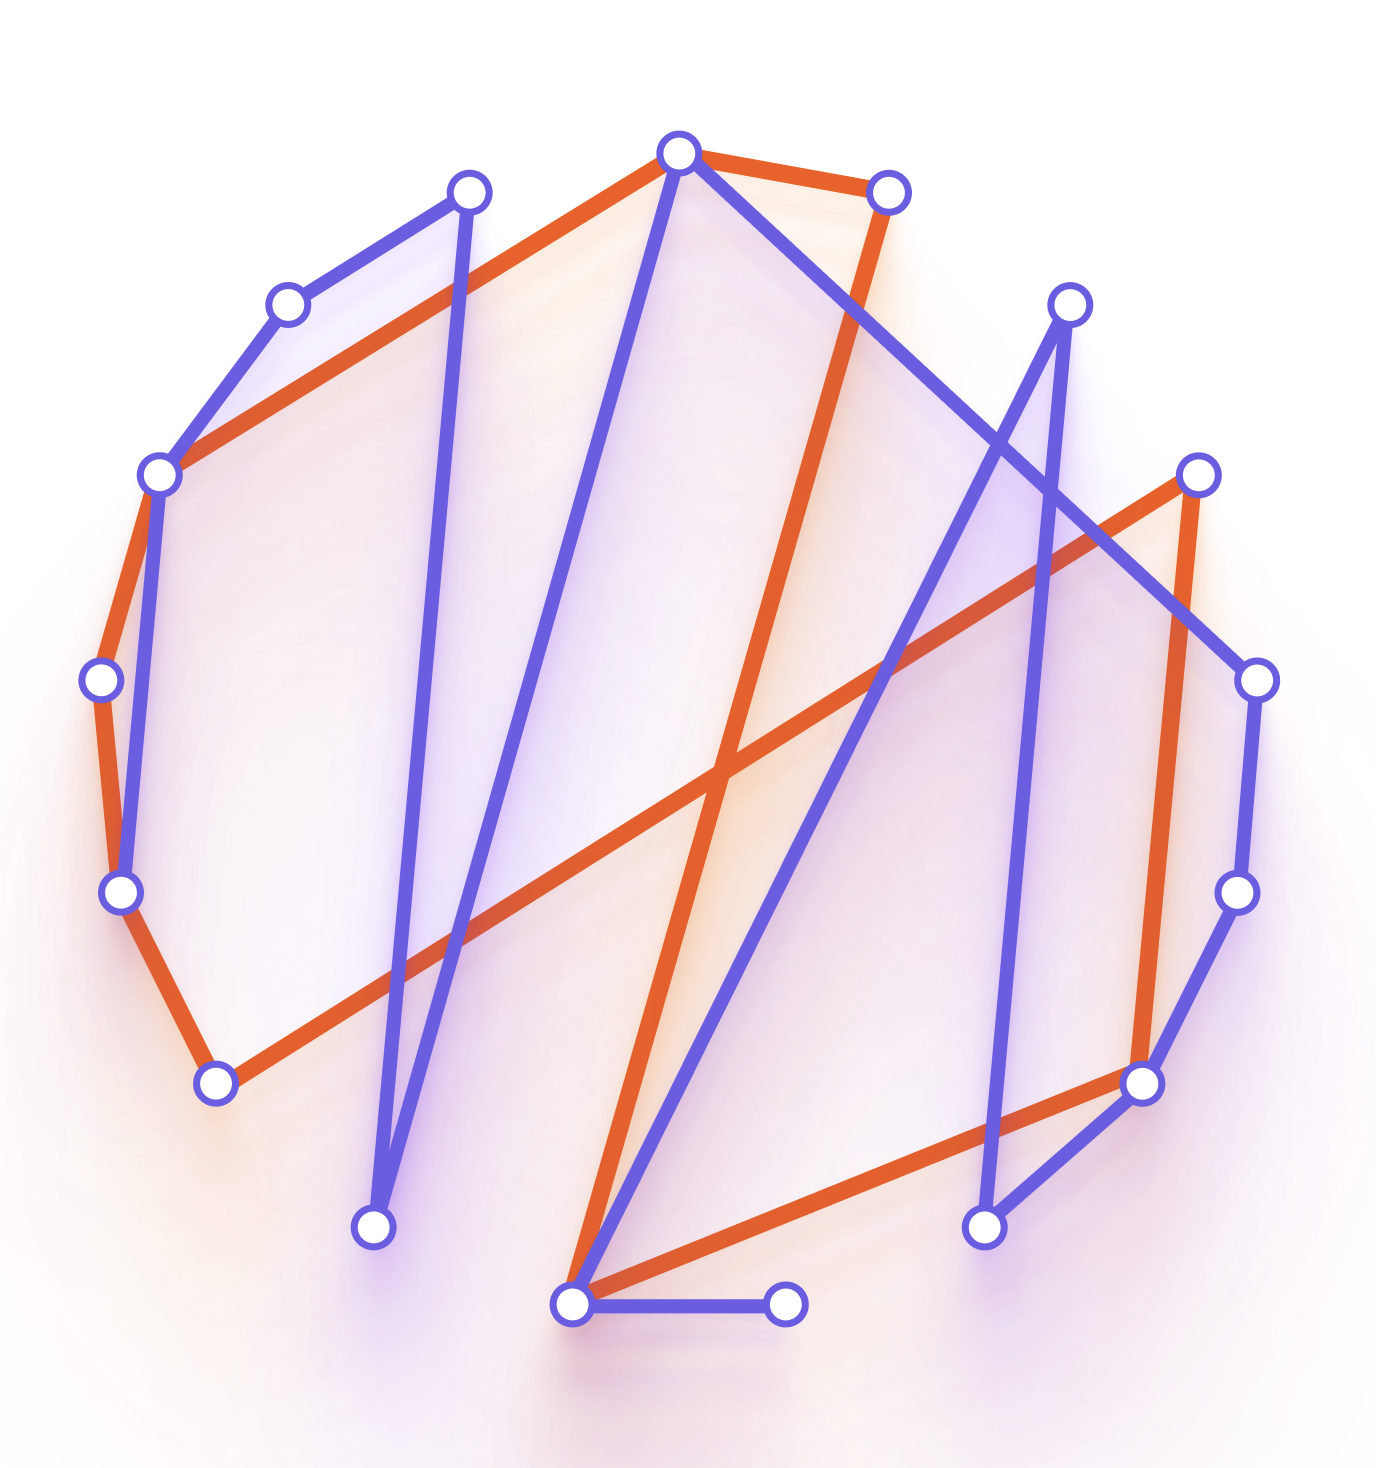
Parallel Coordinates Plot
The Parallel Coordinates plot is a data visualization technique used to visualize and analyze high-d...
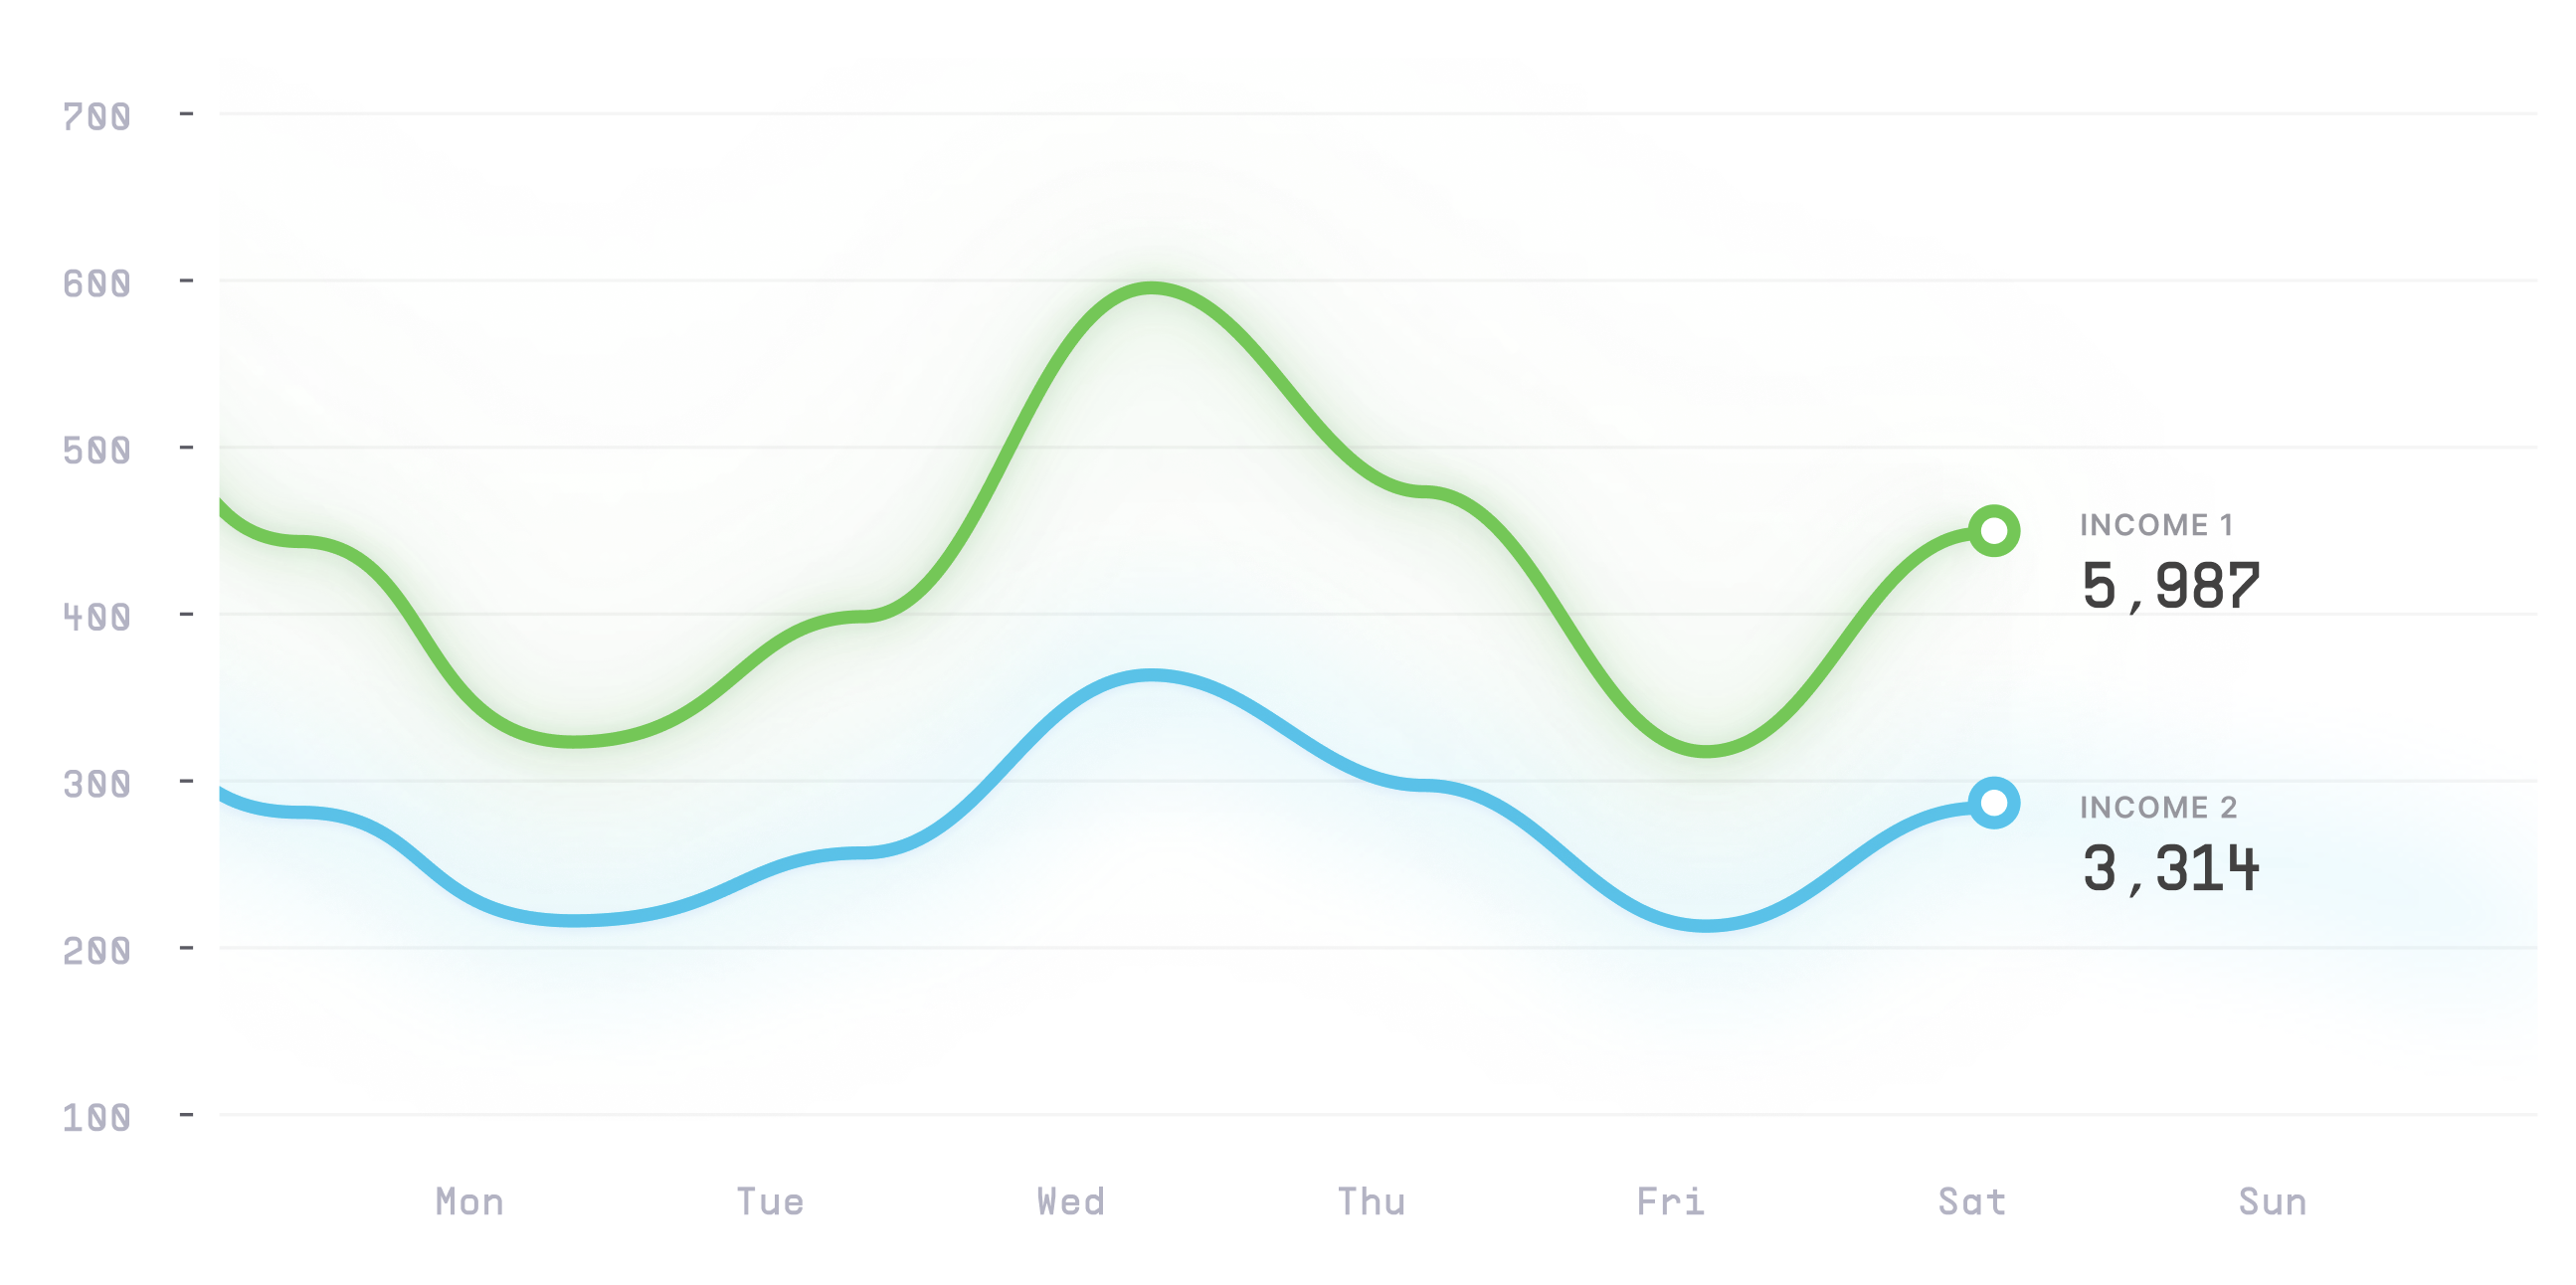
Line Chart
Line chart, also known as a line graph, is a type of chart used to display data as a series of point...
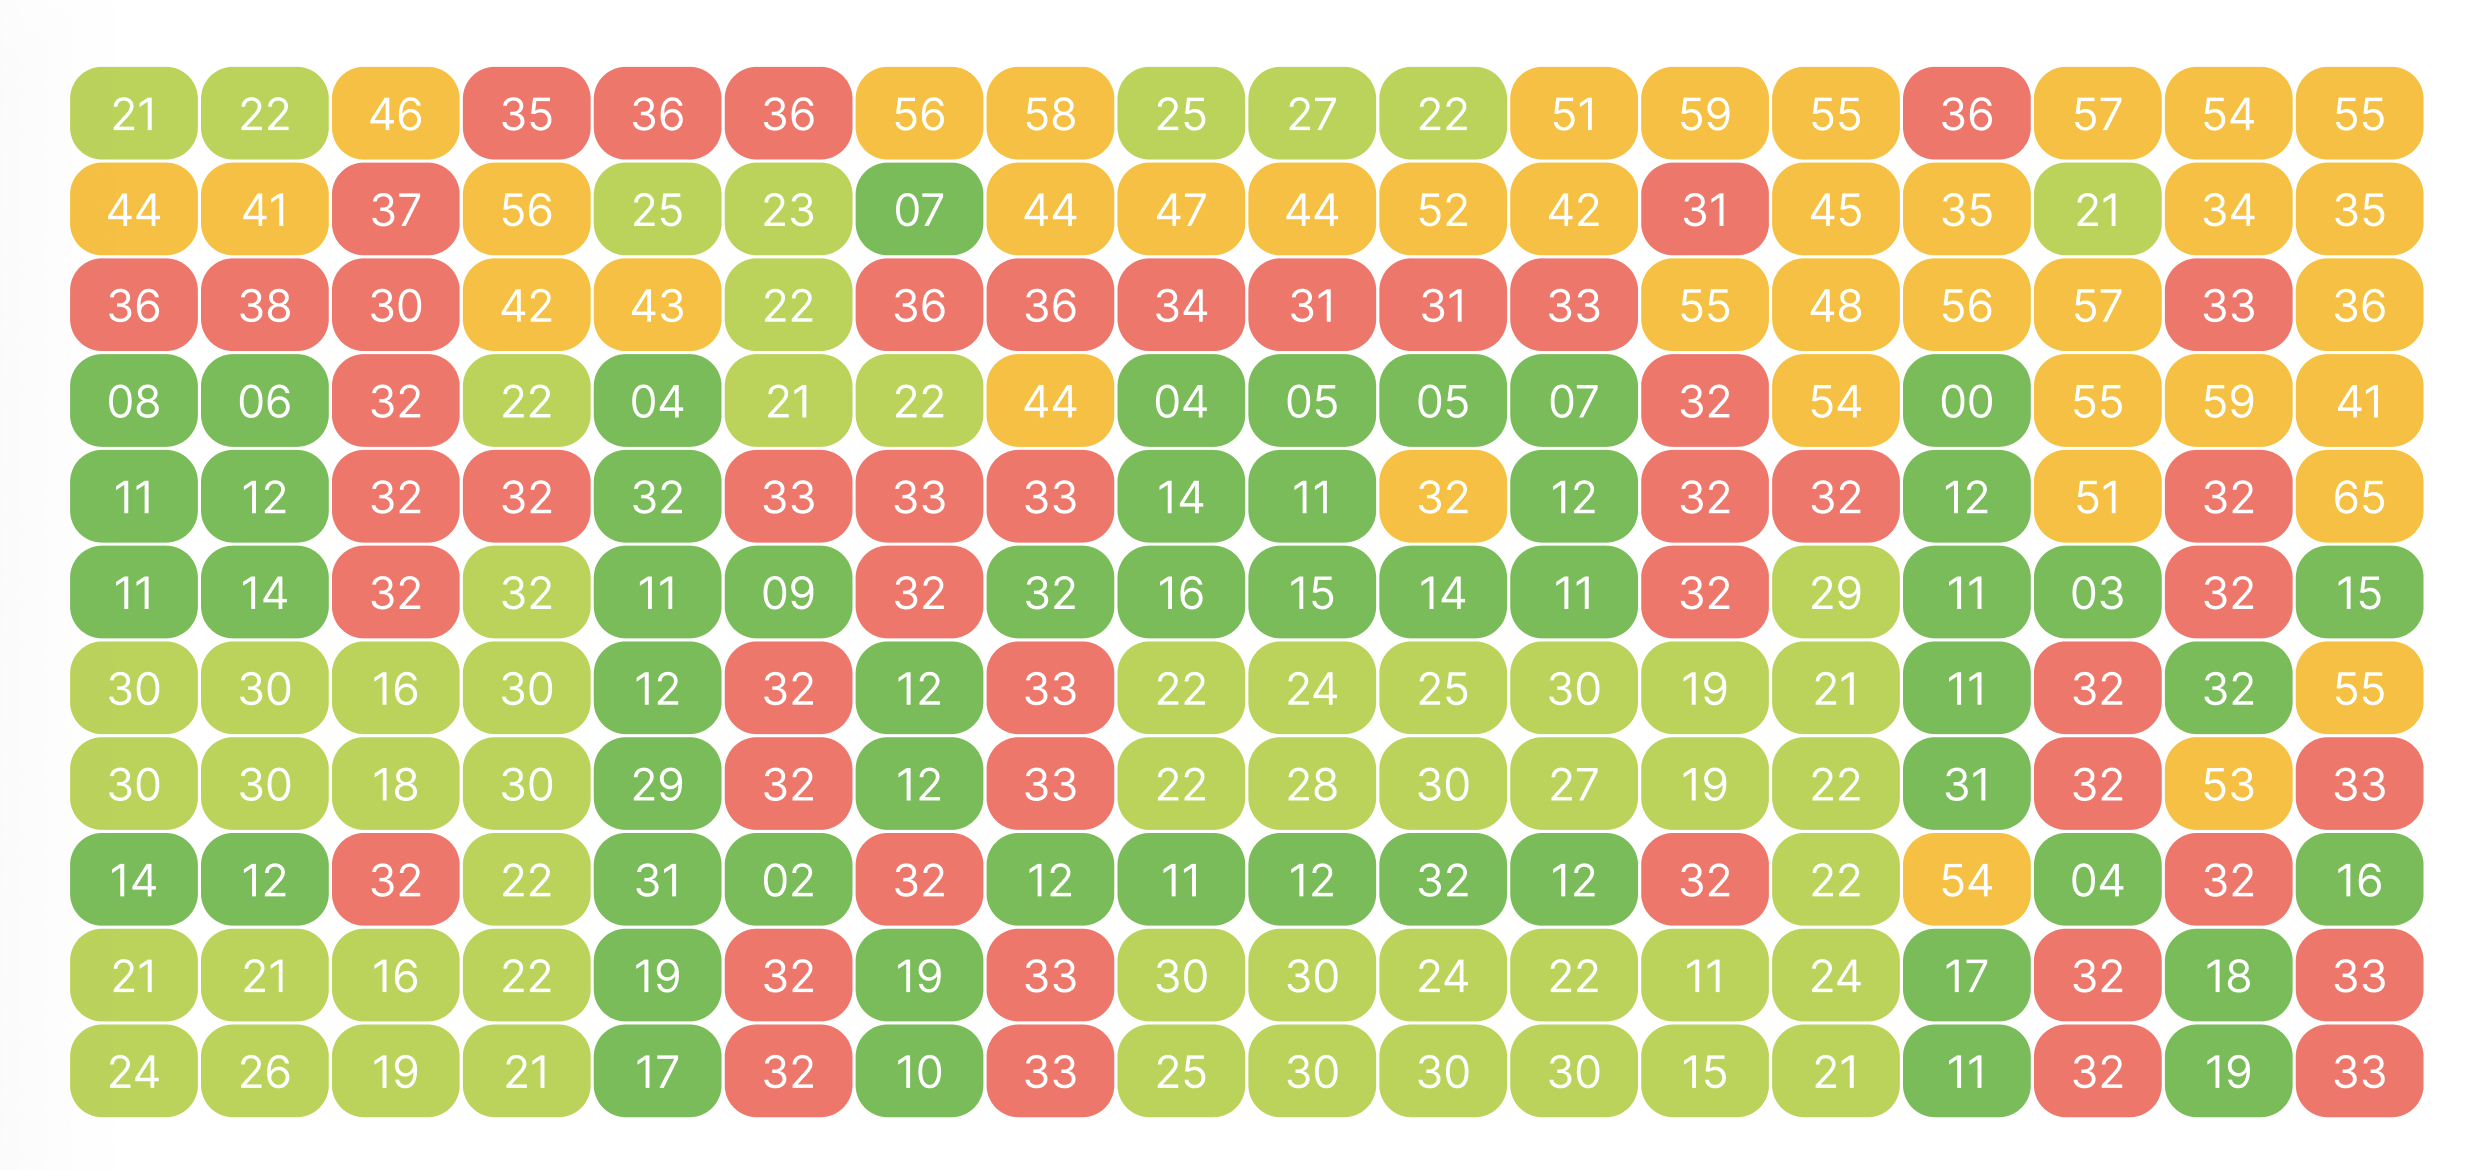
Heat Map
Heat Map, also known as a Heat Table, Density Table, or Heat Chart, is a data visualization chart th...
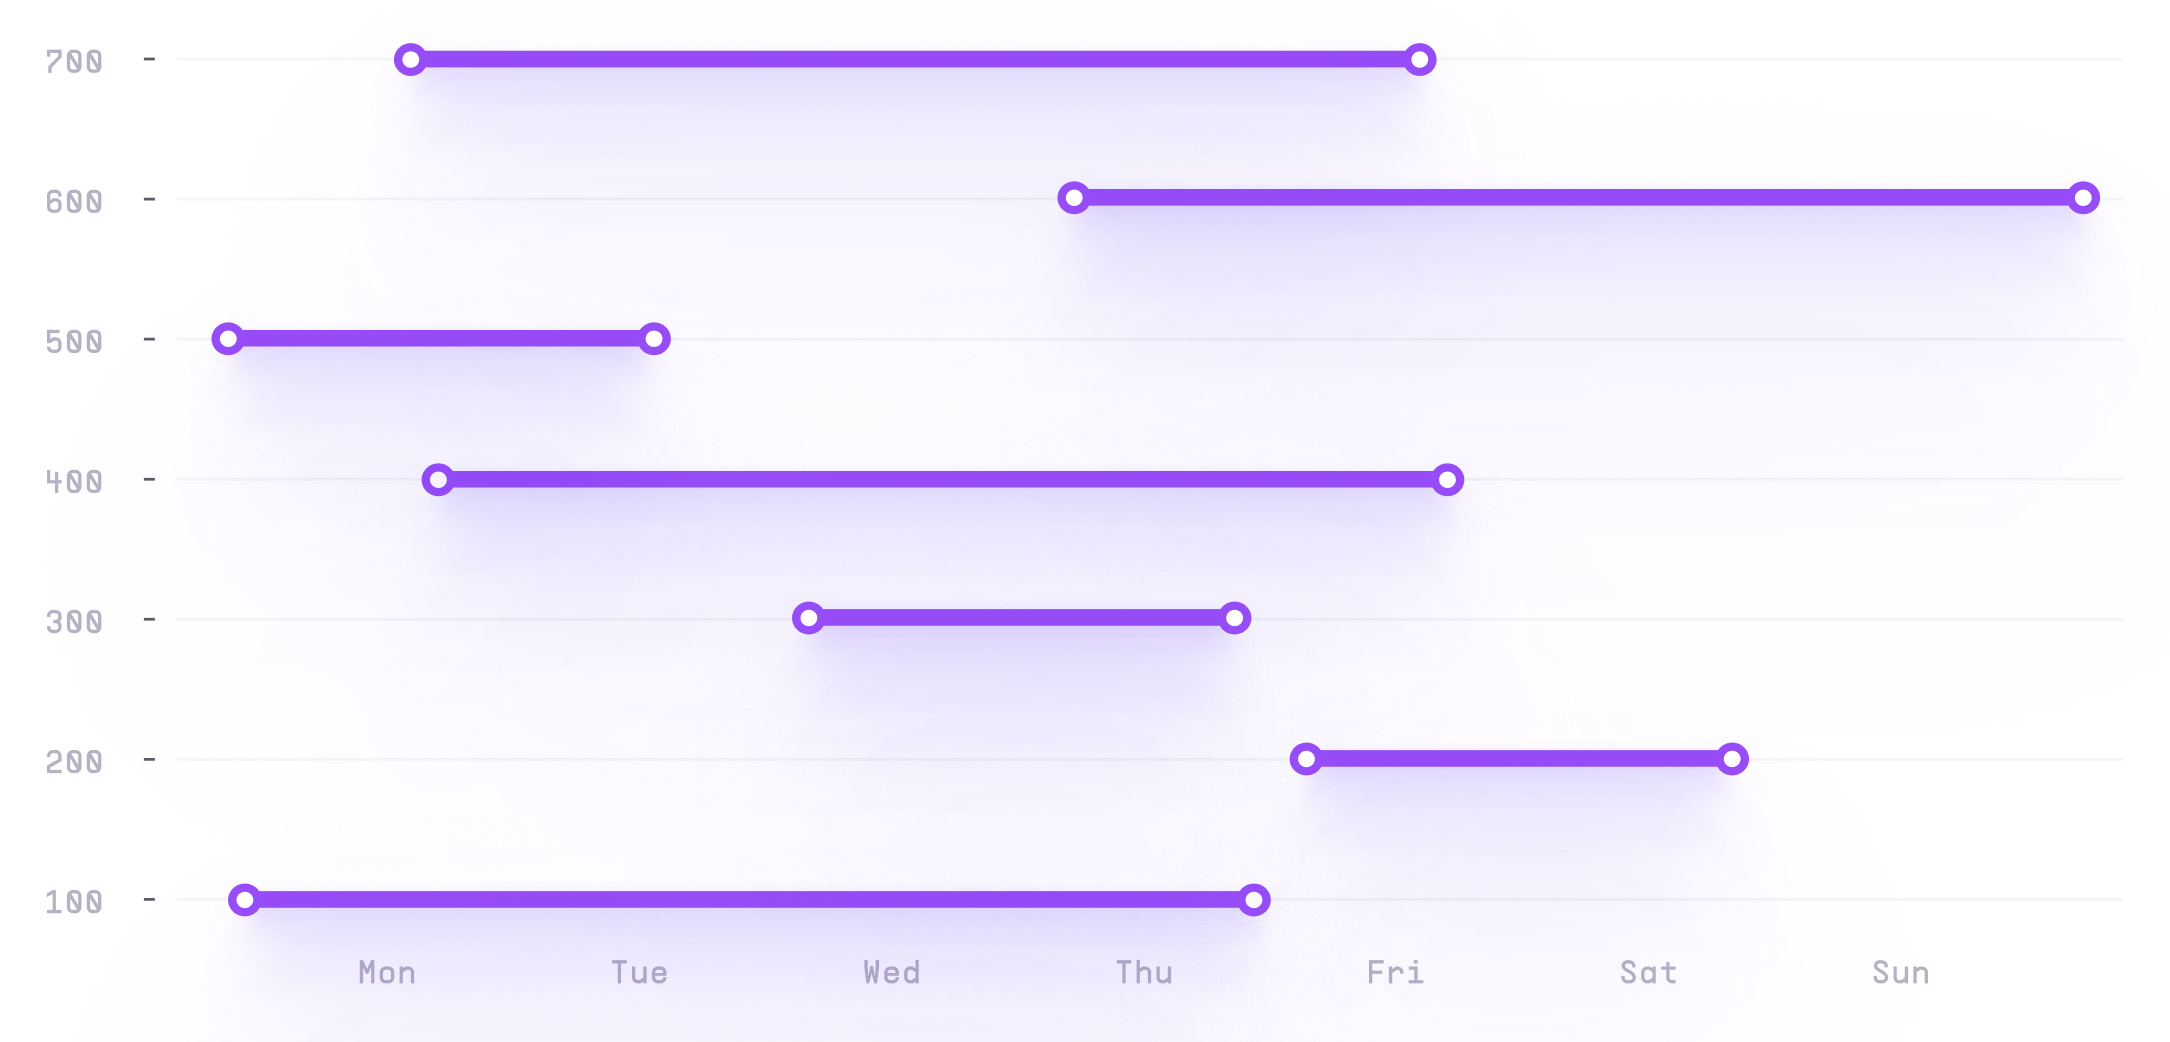
Dumbbell Plot
The Dumbbell Plot is a data visualization chart that is used to compare two sets of data with a comm...
Funnel Chart
Funnel Chart is a data visualization chart that is used to show the stages of a process or sales pip...
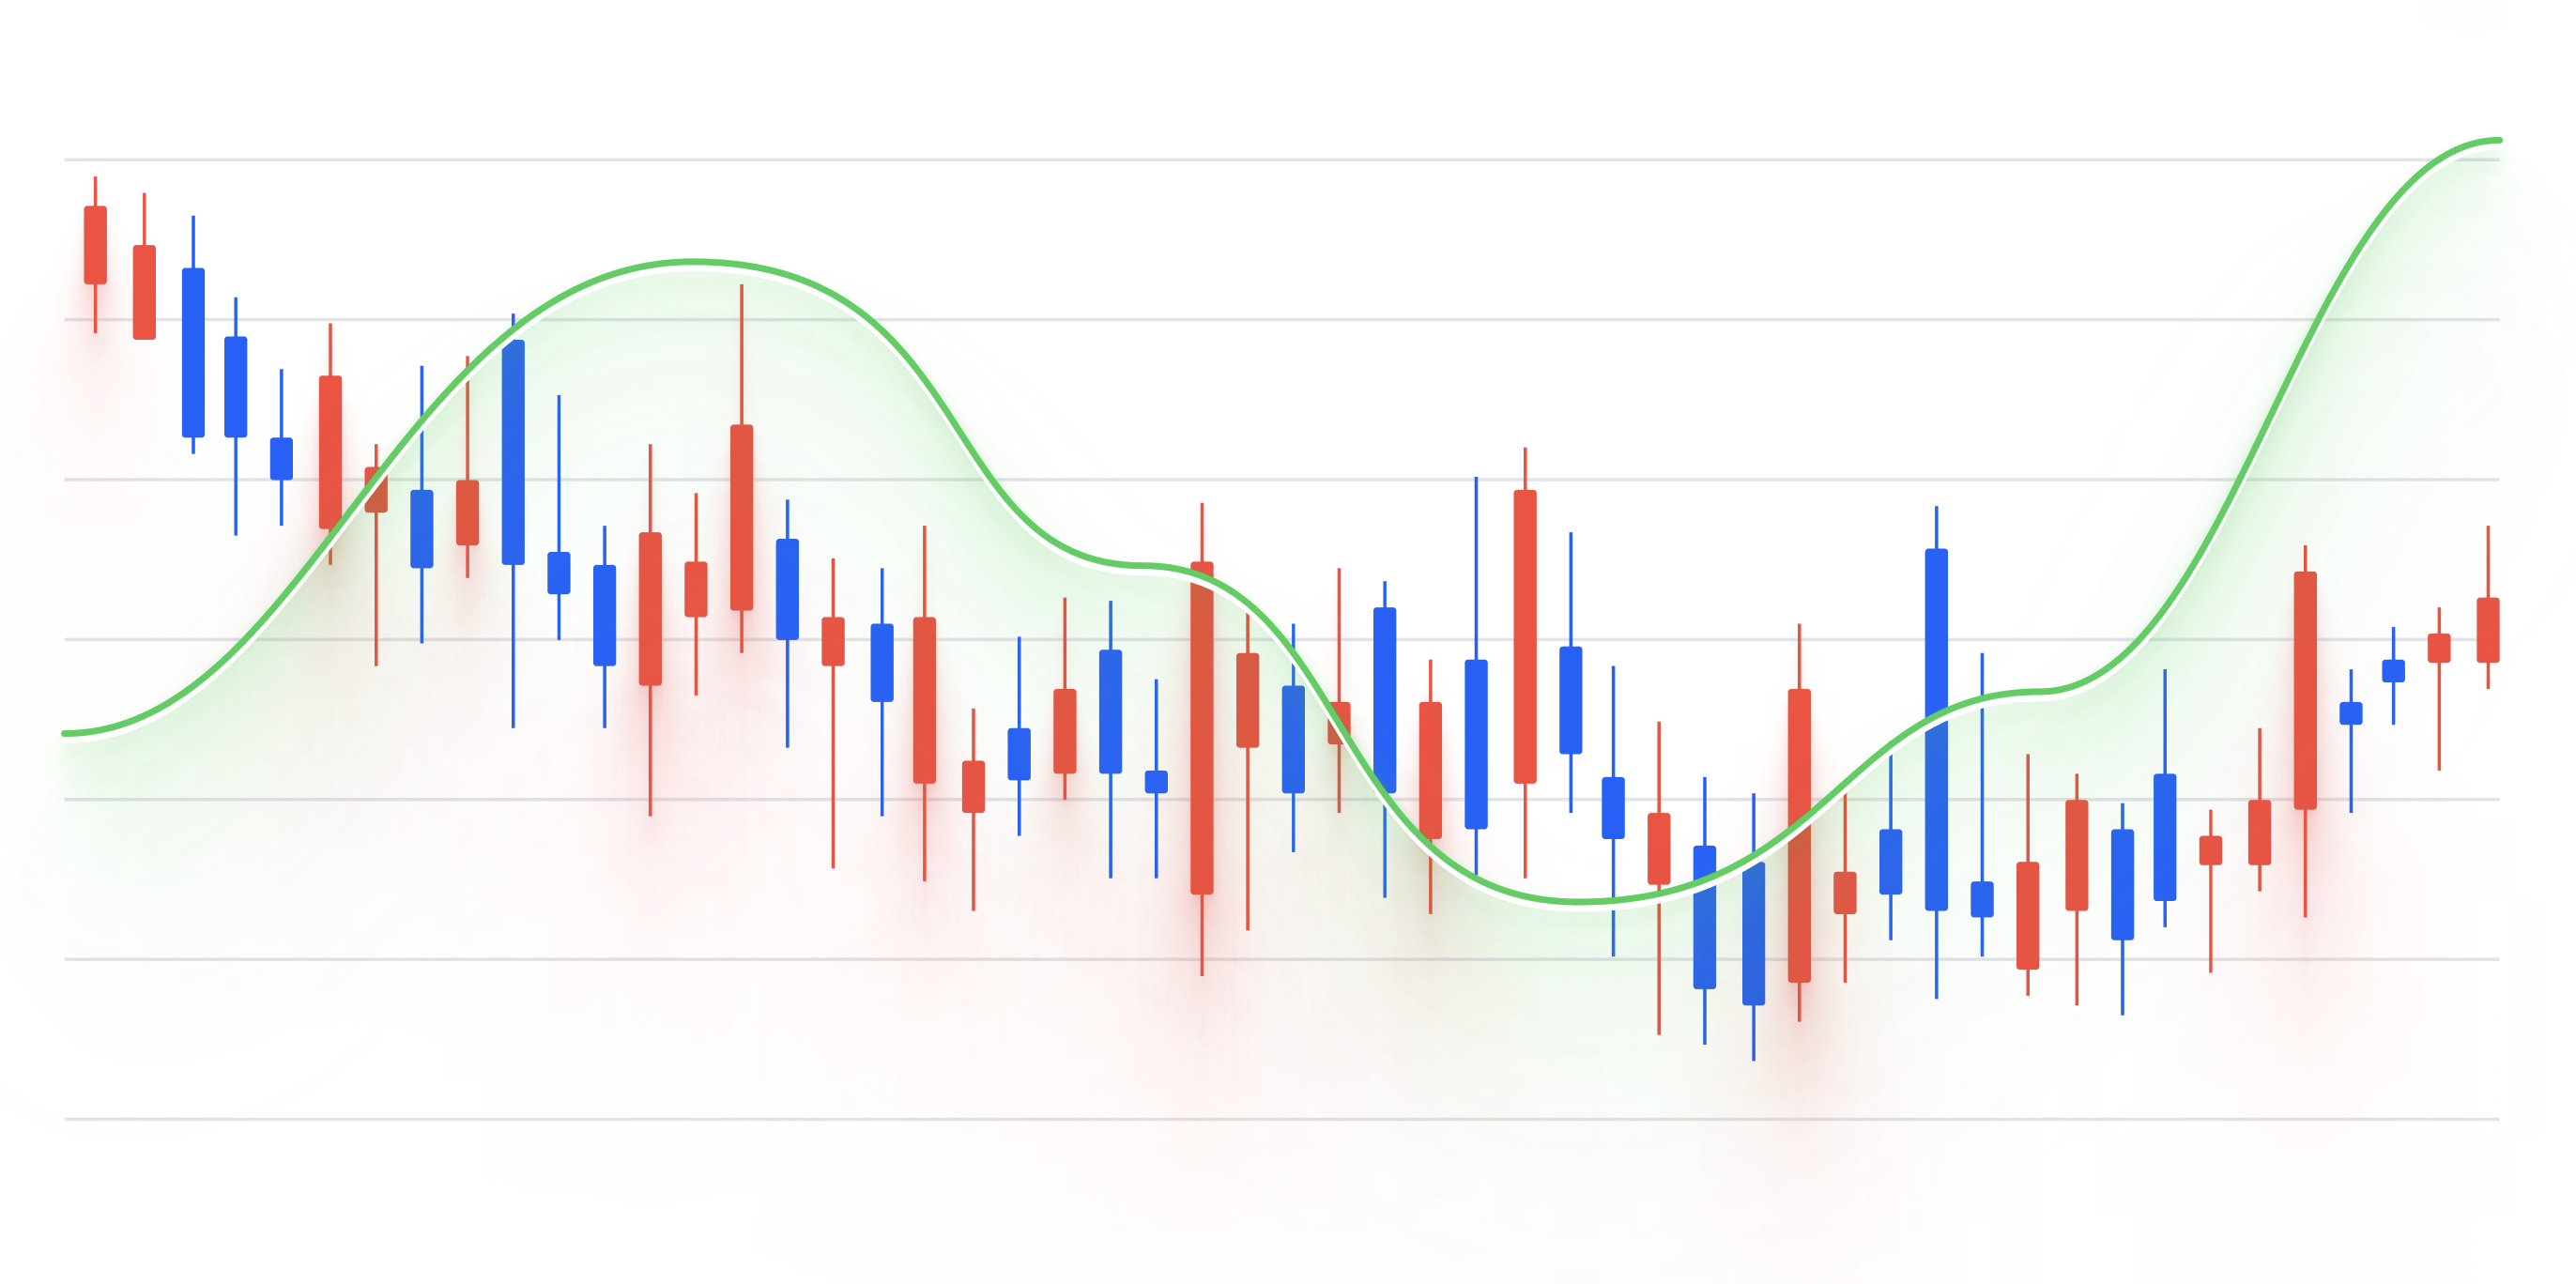
Candlestick Chart
Candlestick chart is a type of financial chart used to display the price movement of an asset over t...
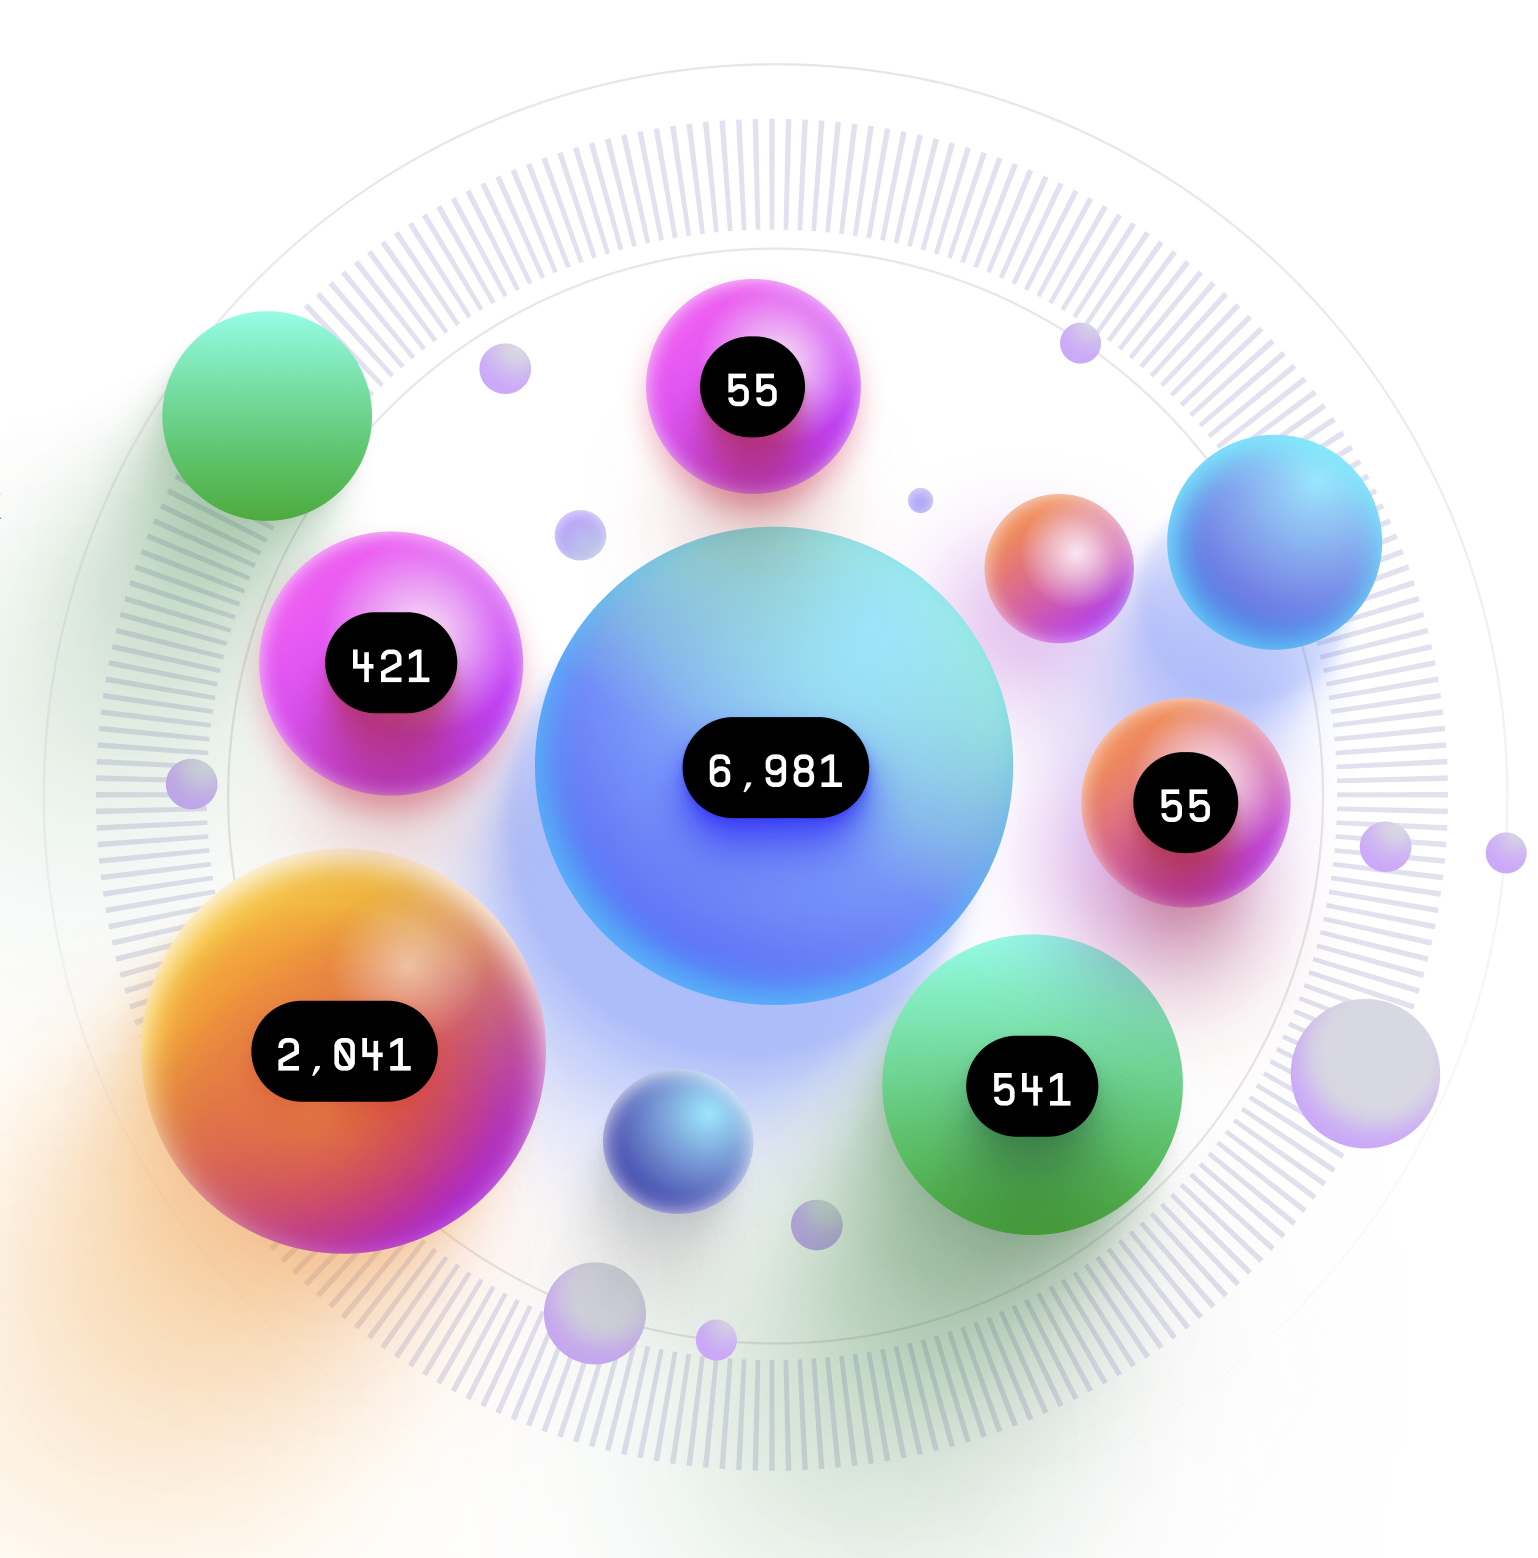
Bubble Chart
The Bubble Chart is a data visualization chart that is used to display three dimensions of data simu...