Line Chart
Overview
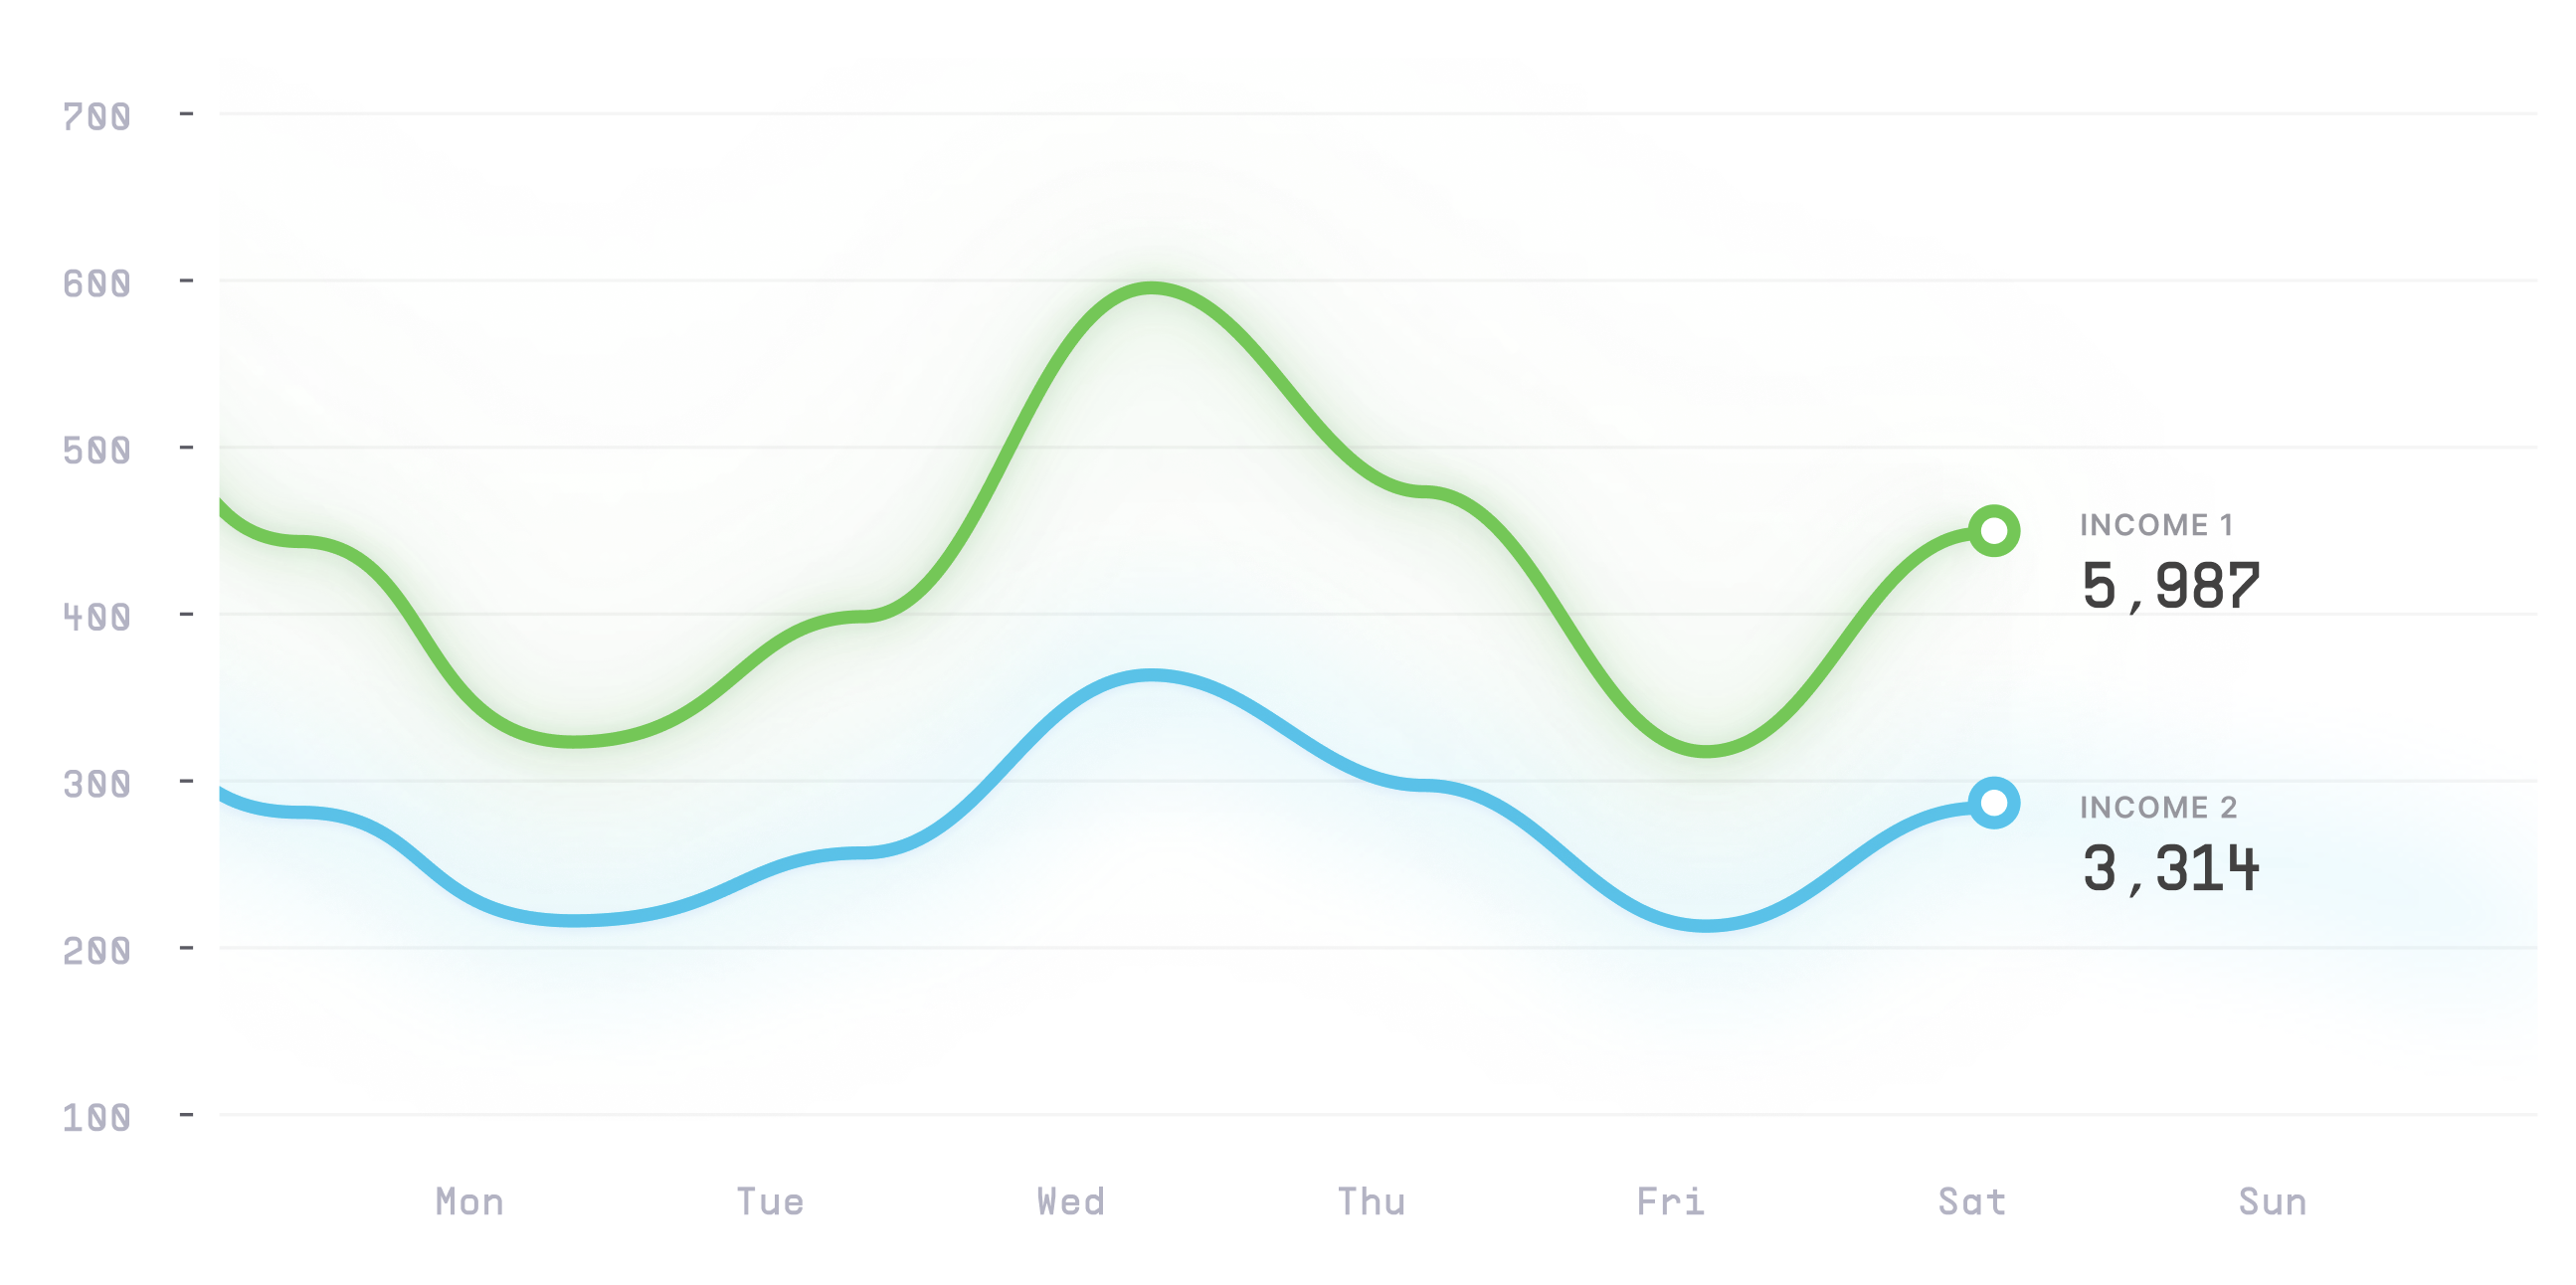
Line chart, also known as a line graph, is a type of chart used to display data as a series of points connected by straight line segments. It's commonly used to show trends or changes in data over time.
Plotting
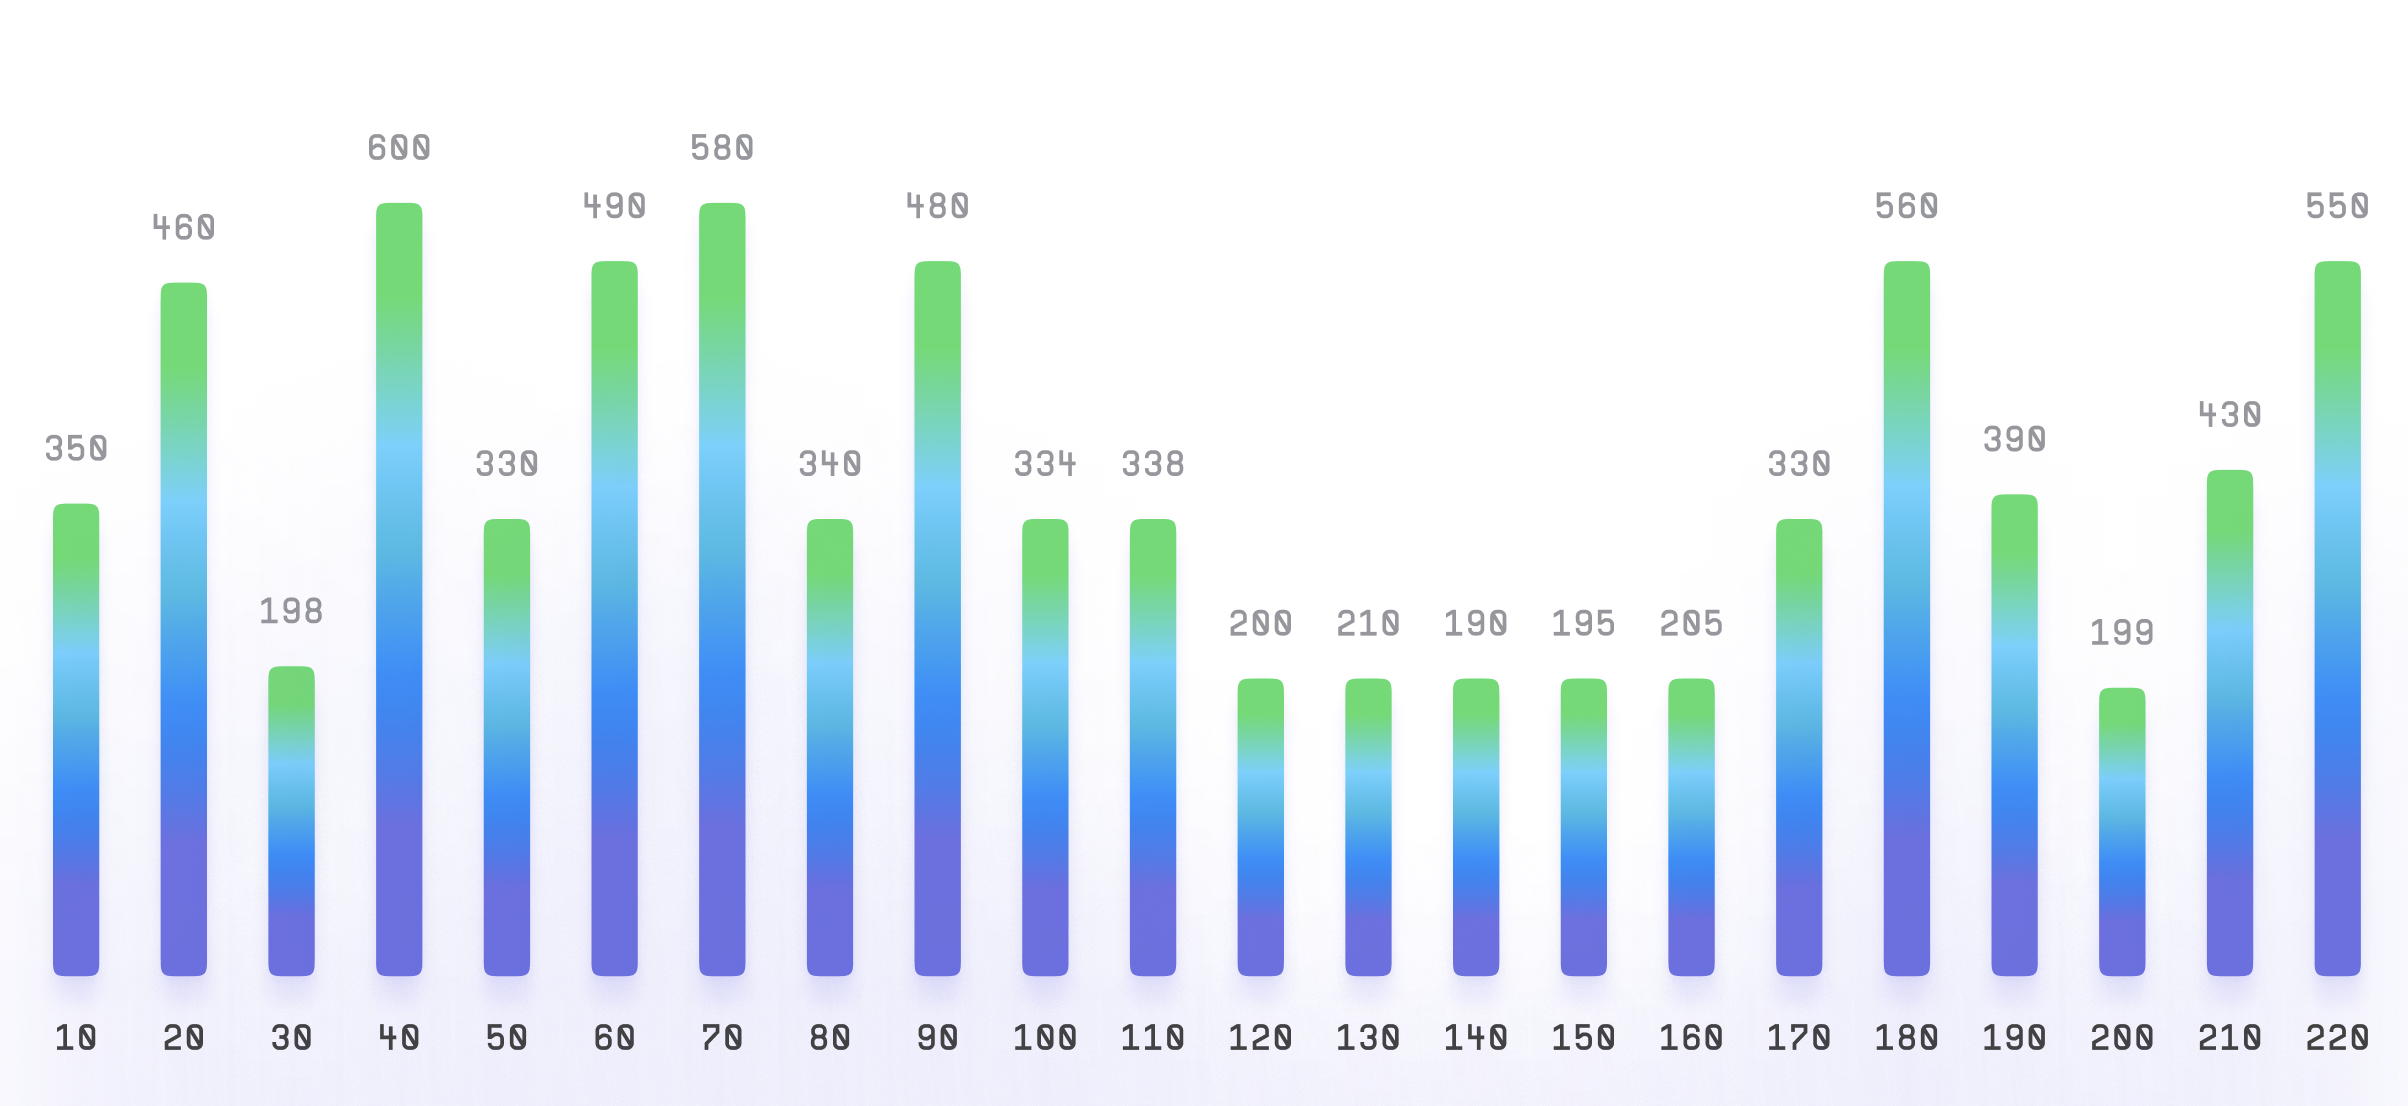
To build a line chart, you would typically need two sets of data: one for the x-axis (usually time) and one for the y-axis (the variable you want to measure). You would then plot the data points on the chart and connect them with straight lines to show the trend.
Summary
Line charts are commonly used in business, finance, economics, and other fields to visualize data that changes over time. For example, a company might use a line chart to show changes in their revenue over the course of a year, or an economist might use a line chart to show changes in unemployment rates over several years. Line charts are also useful for comparing multiple sets of data on the same chart. By plotting multiple lines on the same chart, you can easily compare trends and see how they relate to each other.